Full Report
The numbers behind Comcast Corporation: as-reported financial statements and company metrics for FY2021–FY2025, traced to the source filings, opened with the share-price history those statements have to justify. Every linked figure opens the exact page of the filing it was printed on, with the statement row highlighted. Amounts in US$ millions unless noted.
Reading notes: Comcast's fiscal year is the calendar year (December 31 year-end). Revenue by Segment shows each operating segment's total revenue INCLUDING intersegment revenue, as reported in Note 3; the five segment totals therefore exceed consolidated Total revenue by the amount of Other/Corporate revenue net of eliminations (e.g. FY2025: five segments sum to 129,153 vs 123,707 consolidated). Beginning in Q1 2025 Comcast reclassified certain commission and equipment revenue into video revenue within Residential Connectivity Platforms; product-level revenue lines were restated but segment totals were unaffected, so the segment series is consistent across filings. FY2022 income includes an $8,583M goodwill and long-lived asset impairment (Sky), which drove the drop in operating income and net income that year.
Share Price — Full Available History — 37 Years
The stock closed at $22.30 on Jul 24, 2026 — up 10,993% over the window shown (+13.7% a year), trading between $0.09 and $57.87. At that close the stock trades at 4.4× FY2025 diluted EPS (split-adjusted) as reported below.
Source: market price feed, monthly closes, sampled from 9,208 source observations, Jan 1990–Jul 2026. Price return only, excludes dividends. Prices are split-adjusted (×1.5 on Feb 03, 1994; 1:2 on May 06, 1999; ×1.5 on Feb 22, 2007; 1:2 on Feb 21, 2017; ×1.067 on Jan 05, 2026).
Market capitalization $108.7bn.
Market cap = 4.88B shares outstanding × the Jul 24, 2026 close of $22.30. Market-derived, shown without filing links.
FY2025 at a Glance
Revenue (US$ millions)
Operating income (US$ millions)
Net income (US$ millions)
Diluted EPS
Source: FY2025 consolidated statements [1] [2]. Click any linked figure to open the filing page with the row highlighted.
Revenue by Segment
| Revenue by Segment | FY2021 | FY2022 | FY2023 | FY2024 | FY2025 |
|---|---|---|---|---|---|
| Residential Connectivity and Platforms | 72,694 | 72,386 | 71,946 | 71,574 | 70,704 |
| Business Services Connectivity | 8,056 | 8,819 | 9,255 | 9,701 | 10,237 |
| Media | 27,406 | 26,719 | 25,355 | 28,148 | 27,090 |
| Studios | 10,077 | 12,257 | 11,625 | 11,092 | 11,286 |
| Theme Parks | 5,051 | 7,541 | 8,947 | 8,617 | 9,836 |
| Total revenue | 116,385 | 121,427 | 121,572 | 123,731 | 123,707 |
| Total revenue growth, derived | — | +4.3% | +0.1% | +1.8% | -0.0% |
Source: Note 3: Revenue (segment revenue including intersegment revenue); FY2021–FY2022 from the FY2023 Form 10-K, FY2023–FY2025 from the FY2025 Form 10-K [3] [4]. Click any linked figure to open the filing page with the row highlighted.
Segment Adjusted EBITDA
| Segment Adjusted EBITDA | FY2021 | FY2022 | FY2023 | FY2024 | FY2025 |
|---|---|---|---|---|---|
| Residential Connectivity and Platforms | 25,188 | 26,111 | 26,948 | 27,338 | 26,653 |
| Business Services Connectivity | 4,682 | 5,060 | 5,291 | 5,500 | 5,725 |
| Media | 5,133 | 3,598 | 2,955 | 3,130 | 3,196 |
| Studios | 879 | 961 | 1,269 | 1,404 | 1,099 |
| Theme Parks | 1,267 | 2,683 | 3,345 | 2,949 | 3,080 |
| Total segment Adjusted EBITDA | 37,149 | 38,413 | 39,808 | 40,322 | 39,753 |
Source: Segment information footnote; FY2021–FY2022 from the FY2023 Form 10-K, FY2023–FY2025 from the FY2025 Form 10-K [5] [6] [7] [8]. Click any linked figure to open the filing page with the row highlighted.
Income Statement
Source: Consolidated Statements of Income; FY2021–FY2022 from the FY2023 Form 10-K, FY2023–FY2025 from the FY2025 Form 10-K [1] [2]. Click any linked figure to open the filing page with the row highlighted.
Columns marked E are consensus analyst estimates from S&P Capital IQ (CapIQ), shown alongside reported results for direct comparison; they are not company guidance.
Estimate source: S&P Capital IQ (CapIQ) consensus, as of 2026-07-25. Estimate figures are S&P Capital IQ consensus (vendor data — no filing page links). EPS and net income use the normalized (adjusted) consensus where the street reports it. Line-item analyst models (segments, drivers, KPIs) are in the Visible Alpha tab.
Balance Sheet
Source: Consolidated Balance Sheets; FY2025–FY2024 from the FY2025 Form 10-K, FY2023–FY2022 from the FY2023 Form 10-K, FY2021 from the FY2022 Form 10-K [9] [10] [11]. Click any linked figure to open the filing page with the row highlighted.
Cash Flow
Source: Consolidated Statements of Cash Flows; FY2021–FY2022 from the FY2023 Form 10-K, FY2023–FY2025 from the FY2025 Form 10-K [12] [13]. Click any linked figure to open the filing page with the row highlighted.
Connectivity Customer Base
| Connectivity Customer Base | FY2021 | FY2022 | FY2023 | FY2024 | FY2025 |
|---|---|---|---|---|---|
| Total Connectivity Platforms customer relationships (000s) | 52,412 | 52,425 | 52,136 | 51,609 | 50,766 |
| Total domestic broadband customers (000s) | 32,056 | 32,319 | 32,253 | 31,842 | 31,255 |
| Total domestic wireless lines (000s) | 3,980 | 5,313 | 6,588 | 7,826 | 9,305 |
| Total domestic video customers (000s) | 18,176 | 16,142 | 14,106 | 12,523 | 11,270 |
| Domestic homes and businesses passed (000s) | 60,527 | 61,367 | 62,457 | 63,692 | 64,983 |
| Domestic broadband penetration of homes/businesses passed | 52.8% | 52.5% | 51.5% | 49.8% | 47.6% |
Source: company filings [14] [15]. Click any linked figure to open the filing page with the row highlighted.
Residential Connectivity Revenue Mix
| Residential Connectivity Revenue Mix | FY2021 | FY2022 | FY2023 | FY2024 | FY2025 |
|---|---|---|---|---|---|
| Domestic broadband revenue | — | — | 24,999 | 25,660 | 25,837 |
| Domestic wireless revenue | — | — | 3,664 | 4,273 | 4,967 |
| Video revenue | — | — | 29,576 | 27,791 | 26,387 |
| Advertising revenue (Residential C P) | — | — | 3,969 | 4,089 | 3,712 |
Source: company filings [3]. Click any linked figure to open the filing page with the row highlighted.
Peacock (Streaming)
| Peacock (Streaming) | FY2021 | FY2022 | FY2023 | FY2024 | FY2025 |
|---|---|---|---|---|---|
| Peacock paid subscribers (millions) | 9 | 21 | 31 | 36 | 44 |
| Peacock revenue | 778 | 2,100 | 3,400 | 4,900 | 5,400 |
| Peacock costs and expenses | — | — | 6,100 | 6,700 | 6,500 |
Source: company filings [16] [17] [18]. Click any linked figure to open the filing page with the row highlighted.
Profitability Per-Customer Economics
| Profitability Per-Customer Economics | FY2021 | FY2022 | FY2023 | FY2024 | FY2025 |
|---|---|---|---|---|---|
| Consolidated Adjusted EBITDA | 34,708 | 36,459 | 37,633 | 38,069 | 37,384 |
| Total Connectivity Platforms Adjusted EBITDA margin | 37.0% | 38.4% | 39.7% | 40.4% | 40.0% |
| Avg monthly revenue per C P customer relationship ($) | 129.41 | 129.10 | 129.43 | 130.57 | 131.77 |
| Avg monthly Adjusted EBITDA per C P customer relationship ($) | 47.87 | 49.55 | 51.39 | 52.75 | 52.71 |
Source: company filings [14] [19] [20] [15]. Click any linked figure to open the filing page with the row highlighted.
Long-Term Record
| Fiscal year | Total revenue | Operating income | Net income | Diluted EPS | Operating cash flow | Capital expenditures |
|---|---|---|---|---|---|---|
| FY2016 | — | 16,831 | 8,678 | 1.78 | 19,691 | 9,135 |
| FY2017 | — | 18,018 | 22,735 | 4.75 | 21,261 | 9,550 |
| FY2018 | — | 19,009 | 11,731 | 2.53 | 24,297 | 9,774 |
| FY2019 | 108,942 | 21,125 | 13,057 | 2.83 | 25,697 | 9,953 |
| FY2020 | 103,564 | 17,493 | 10,534 | 2.28 | 24,737 | 9,179 |
| FY2021 | 116,385 | 20,817 | 14,159 | 3.04 | 29,146 | 9,174 |
| FY2022 | 121,427 | 14,041 | 5,370 | 1.21 | 26,413 | 10,626 |
| FY2023 | 121,572 | 23,314 | 15,388 | 3.71 | 28,501 | 12,242 |
| FY2024 | 123,731 | 23,297 | 16,192 | 4.14 | 27,673 | 12,181 |
| FY2025 | 123,707 | 20,672 | 19,998 | 5.39 | 33,643 | 11,750 |
Source: consolidated statements across filings; older years from the standardized feed [12] [1] [21]. Click any linked figure to open the filing page with the row highlighted.
Operating KPIs
| KPI | FY2021 | FY2022 | FY2023 | FY2024 | FY2025 |
|---|---|---|---|---|---|
| Total domestic broadband customers | 32,056,000 | 32,319,000 | 32,253,000 | 31,842,000 | 31,255,000 |
| Total domestic wireless lines | 3,980,000 | 5,313,000 | 6,588,000 | 7,826,000 | 9,305,000 |
| Total domestic video customers | 18,176,000 | 16,142,000 | 14,106,000 | 12,523,000 | 11,270,000 |
Source: company-reported operating metrics [14] [15]. Click any linked figure to open the filing page with the row highlighted.
Analyst Consensus
Mean target
Median target
High target
Low target
Street ratings: 8 strong buy, 1 buy, 16 hold, 1 sell, 2 strong sell. Consensus: Hold.
Estimate source: S&P Capital IQ (CapIQ) consensus, as of 2026-07-25. Estimate figures are S&P Capital IQ consensus (vendor data — no filing page links). EPS and net income use the normalized (adjusted) consensus where the street reports it. Line-item analyst models (segments, drivers, KPIs) are in the Visible Alpha tab.
Traceability
400 of 442 figures on this page (90%) link to the filing page where they are printed — click a linked figure to open the source PDF at that page with the row highlighted. Unlinked figures come from standardized data feeds or pre-filing years.
Comcast's fiscal year is the calendar year (December 31 year-end).
Revenue by Segment shows each operating segment's total revenue INCLUDING intersegment revenue, as reported in Note 3; the five segment totals therefore exceed consolidated Total revenue by the amount of Other/Corporate revenue net of eliminations (e.g. FY2025: five segments sum to 129,153 vs 123,707 consolidated).
Beginning in Q1 2025 Comcast reclassified certain commission and equipment revenue into video revenue within Residential Connectivity Platforms; product-level revenue lines were restated but segment totals were unaffected, so the segment series is consistent across filings.
FY2022 income includes an $8,583M goodwill and long-lived asset impairment (Sky), which drove the drop in operating income and net income that year.
Segment Adjusted EBITDA is a non-GAAP measure reported by segment; the FY2021–FY2022 total row is left blank because the FY2023 Form 10-K does not print a five-segment total (it reconciles to a consolidated figure after headquarters/corporate items).
FY2016–FY2018 revenue is not available in the corpus (only FY2021–FY2025 10-Ks are indexed) and the numeric feed carries no pre-FY2022 revenue, so those long-term revenue cells are blank; FY2019–FY2020 revenue is taken from the FY2021 Form 10-K MD A.
FY2016–FY2020 long-term rows (operating income, net income, diluted EPS, operating cash flow, capital expenditures) come from the standardized SEC XBRL data feed and are shown without page links.
Quarterly cash-flow single quarters are derived from the printed year-to-date statements; each derived value reconciles exactly to the difference of two printed YTD figures and was cross-checked against the quarterly cash-flow data feed.
Q2 FY25 diluted EPS of 2.98 reflects a large non-operating investment gain recognized that quarter (investment and other income of 9,760M).
3 figure(s) differed between the data feed and the filing; the filing value is shown (see the run's metrics/metrics_tab.json for the audit trail).
Comcast Corporation's management answers for the business every quarter. These are the exchanges that explain it best — verbatim, from the call transcripts preserved in Sources. Each link opens the full transcript at that page in a new tab.
Q2 2026 Earnings Call — Q2 FY2026
The freshest read on the broadband pivot — deliberate ARPU dilution, a record wireless quarter, and Peacock's first profitable quarter. · Open the full transcript →
Why broadband ARPU fell 3.8% on purpose: no rate hike, lower simplified pricing, and dilutive free wireless lines.
Jason Armstrong (CFO): At the same time, we have been transparent that this pivot comes with investment. We made several deliberate choices this year to reposition the business for stronger long-term performance. We did not take a broadband rate increase, and we've been migrating customers into simplified pricing with lower everyday price points. At the same time, we continue to see strong adoption of free wireless lines, which is initially dilutive to broadband ARPU. As a result, broadband ARPU declined 3.8% in the quarter. Additionally, we continue to invest in the customer experience and go-to-market capabilities needed to support this broader shift, which contributed to a 5.8% decline in Connectivity & Platforms EBITDA.
p. 13 · Read in context →
A record 448,000 wireless net adds, half from free lines — the top of the funnel management intends to monetize.
Jason Armstrong (CFO): Wireless had another very strong quarter. We added 448,000 net lines. That's our best quarter on record with roughly half of our residential postpaid phone connects coming from customers taking a free line. We are actively leaning into this opportunity. The free line offer is doing what we intended. It's building awareness, it's driving attachment and it's expanding the base of customers we can convert into paying wireless relationships over time.
p. 14 · Read in context →
Business Services mix shift in one number: advanced-solutions attach up from about $0.20 to ~$0.70 per dollar of connectivity.
Jason Armstrong (CFO): Importantly, the mix shift towards advanced solutions continues to scale. 3 years ago, for every dollar of connectivity we sold, we sold about $0.20 of advanced solutions. Today, that figure is closer to $0.70, underscoring the increasing value we are delivering to customers.
p. 15 · Read in context →
Peacock's first profitable quarter ($189M EBITDA), the payoff of a multi-year dual-revenue model.
Jason Armstrong (CFO): Turning to Media. We achieved an important milestone as Peacock reached profitability for the first time, generating $189 million of EBITDA in the quarter. This reflects the strategy we have been executing for several years, building Peacock around a dual revenue model supported by a broad content mix across sports, next-day NBC and Bravo, film, originals, news, library and major events.
p. 16 · Read in context →
Q4 & Full-Year 2025 Earnings Call — Q4 FY2025
The strategic reset: a new Connectivity CEO, the largest go-to-market shift in company history, and the case for staying a conglomerate. · Open the full transcript →
Framing 2025 as an inflection point and introducing Steve Croney's mandate to reset priorities for growth.
Brian Roberts (Chairman and CEO): We are at an inflection point, both in our industry and at Comcast Corporation. The business is changing rapidly, and competition has never been more intense. The choices we are making right now matter. […] Steve Crony joins us for the first time on this call today. From day one running this business, he challenged long-held assumptions and moved quickly to reset priorities around actions that will drive growth.
p. 1 · Read in context →
Wireless as the convergence engine: ~1.5M net lines in 2025, 15% penetration, and a capital-light, profitable model.
Michael Cavanagh (Co-CEO): Wireless continues to be a powerful driver of that convergence strategy, and 2025 was our strongest year yet. We added approximately 1,500,000 net lines, ending the year with over 9,000,000 total lines and roughly 15% penetration of our residential broadband base. That performance reinforces wireless as a key growth engine for the company while also strengthening customer relationships and lifetime value across our connectivity portfolio. Even as wireless competition intensifies, our broadband scale, industry-leading Wi-Fi, and improving offers position us well to grow wireless profitably while maintaining a disciplined long-term approach.
p. 2 · Read in context →
How straight-lining NBA rights front-loads EBITDA dilution — and why Q1's ~50% game load is the peak drag.
Jason Armstrong (CFO): Media EBITDA declined in the quarter, primarily reflecting the addition of NBA rights. As we have discussed, we are straight-lining the amortization of these sports rights, which creates upfront EBITDA dilution, particularly in the first season, with game counts driving the quarterly realization of this expense. While the fourth quarter represented about 25% of our total games for the season, the first quarter will be the peak volume period with roughly 50% of our games played, which will also result in peak EBITDA dilution. Over time, we expect to offset this impact through advertising growth and subscriber acquisition and monetization across both linear and Peacock.
p. 5 · Read in context →
The operating philosophy: assume no relief in competition and win on network, product and experience.
Steve Croney (CEO, Connectivity & Platforms): When I think about what success looks like, it starts with being honest with ourselves and clearly defining our reality. The market is going to remain intensely competitive. Success is not about waiting for the environment to change; it is about how we perform inside of that environment. […] It does not assume relief in the competitive environment, and it does not rely on any one lever. It is about executing better with the industry's best products, a differentiated Wi-Fi-first experience, and a unified team focused on growth.
p. 6 · Read in context →
Asked why not break up given the conglomerate discount, management argues NBCUniversal is stronger inside Comcast.
Jessica Reif Cohen (BofA Securities); Michael Cavanagh (Co-CEO): Can you step back and talk about how you are thinking about your asset portfolio over the next twelve to twenty four months or longer? And what would need to change for you to consider a different structural approach to the media assets to recognize the value and potentially strategic flexibility? […] we do not really see that there is a strategic advantage or making NBCUniversal stronger by separating it from the cable side of the house or putting it outside of Comcast Corporation. So start there. So the advantages we have sitting inside the company do not get stronger by being smaller as a standalone entity is our view.
p. 9 · Read in context →
Q3 2024 Earnings Call — Q3 FY2024
The convergence thesis in full — 63M-home reach, the Olympics as a platform, Epic's reveal, and the first public word on a cable-networks spin. · Open the full transcript →
How Comcast defines convergence and why 63M gig-plus homes plus ubiquitous wireless is a hard-to-match moat.
Michael Cavanagh (President): On convergence, which we define as the combination of ubiquitous high-speed Internet along with wireless phone, by that definition, we are positioned to win. And that is because, today, we have 63 million homes and businesses already able to receive gig-plus broadband speed and we also offer wireless service everywhere we provide broadband. This reach far exceeds the fiber footprints of the largest three telecom companies combined, and our footprint is growing at a rapid pace. In fact, we've extended our network to more than 1.2 million additional homes and businesses over the last 12 months, a 50%-plus increase over what we were able to do just two years ago. So, even accounting for the announced fiber buildout plans of those three wireless companies, we expect to maintain this lead well into the future. Broadband usage is skyrocketing. Our broadband-only customers are heavy data users, averaging 700 gigabytes per month. And we want it that way because our existing network can handle significant increase in bandwidth consumption at a very low marginal cost.
p. 1 · Read in context →
Epic Universe's May 2025 opening, framed to turn Orlando into a week-long, four-park destination.
Michael Cavanagh (President): We recently announced that Epic will open on May 22, 2025, and have also started to activate our sales and marketing plans, including the sale of vacation packages that provide the opportunity to visit Epic, which we expect to be in very high demand. […] Once Epic opens, Universal Orlando will be transformed into a week's long vacation, offering four theme parks, a CityWalk dining, retail and entertainment district and 11 hotels.
p. 1 · Read in context →
The Paris Olympics as a cross-company platform: record reach and $1.9B of incremental media revenue.
Michael Cavanagh (President): We brought new relevance and excitement to the Olympics by flawlessly presenting the biggest and most complex Olympic Games in history, dominating television, streaming, news and social media for 17 straight days. Daily viewership averaged over 30 million across our platforms, an increase of 80% compared to the prior Summer Olympics in 2021, and Peacock streamed 23.5 billion minutes, up 40% from all prior Summer and Winter Olympics combined. All of this leading to a record high $1.9 billion of incremental Olympics revenue in our Media segment this third quarter.
p. 1 · Read in context →
The first public word on exploring a spin of the cable networks into a separate, shareholder-owned company.
Michael Cavanagh (President): like many of our peers in media, we are experiencing the effects of the transition in our video businesses and have been studying the best path forward for these assets. To that end, we are now exploring whether creating a new wellcapitalized company, owned by our shareholders and comprised of our strong portfolio of cable networks, would position them to take advantage of opportunities in the changing media landscape and create value for our shareholders.
p. 1 · Read in context →
Two decades competing with fiber: share settles roughly even and ARPU holds — the case behind footprint expansion.
Jason Armstrong (CFO); Craig Moffett (MoffettNathanson): Fiber, as we've said, is the real long-term competitor. That's an entity that's been building out against us for almost 20 years at this point. It's been sort of a steady increase in our footprint. Right now, we're about 50% overbuilt. […] So, if you go back and look at some of the early fiber markets and tenure markets where we've had a chance to sort of see the competitive progression, what you see is initial uptake and then you see the competitive environment sort of leveling out and you see relatively even share between us and fiber. We see ARPUs in those markets that are very consistent with our overall ARPU.
p. 7 · Read in context →
Q4 & Full-Year 2023 Earnings Call — Q4 FY2023
The streaming-and-network inflection: the first all-streamed NFL playoff game, Peacock past peak losses, and the DOCSIS 4.0 roadmap. · Open the full transcript →
The first exclusively streamed NFL playoff game, offered as proof the network is built for a high-bandwidth era.
Michael Cavanagh (President): Two weeks ago, our entire company came together to make history, shattering records with the first exclusively streamed NFL Wildcard Game on Peacock. Nearly 23 million viewers watched the Kansas City Chiefs take on the Miami Dolphins, consuming 30% of all internet traffic in the U.S. and setting a new record in total U.S. internet traffic for any night. Our investment in the network and our technology platforms built over decades enabled us to shine, delivering a seamless experience on the internet and Peacock, demonstrating that our company is in an excellent position to win in this era of high bandwidth consumption.
p. 2 · Read in context →
Why usage growth favors cable: an 'unrivalled' marginal cost to add capacity, funding mid-splits and DOCSIS 4.0.
Jason Armstrong (CFO): At the macro level, customers are consuming more, connecting more devices in their homes, and are using them for applications that collectively require either faster speeds, lower latency, and higher reliability over time. These secular trends are all moving in our favor, and we believe our marginal cost to add capacity to our network is unrivalled. This is why we are investing in our fiber-fed network to further increase capacity and offer multi-gig symmetrical speeds ubiquitously across our footprint and ensure that we stay way ahead of consumer demand with the best broadband offering and experience. We have deployed mid-splits to about 35% of our footprint and expect that to reach around 50% by the end of 2024.
p. 7 · Read in context →
The capital-allocation frame: a 16th straight dividend raise and 2.3x leverage alongside organic investment.
Jason Armstrong (CFO): As we announced this morning, we are raising our dividend by $0.08 a share to $1.24 per share – that’s our 16th consecutive annual increase. We ended the year with net leverage of 2.3 times, in line with our target leverage of around 2.4 times, and we expect to remain at this target level in 2024.
p. 11 · Read in context →
More calls
Q1 2026 Earnings Call — Q1 FY2026 · 11 pages · Where management separates durable broadband improvement from one-off boosts (Legendary February) and details the mobile WiFi-offload cost advantage. · Open →
Q3 2025 Earnings Call — Q3 FY2025 · 10 pages · The free-wireless-line monetization playbook, the XB10 WiFi gateway, and Epic's ramp — plus a guarded take on Warner Bros. Discovery M&A speculation. · Open →
Q2 2025 Earnings Call — Q2 FY2025 · 11 pages · The quarter Epic Universe opened and the new nationwide 'everyday pricing' structure rolled out, alongside the T-Mobile business MVNO. · Open →
Q1 2025 Earnings Call — Q1 FY2025 · 12 pages · The launch of the five-year price guarantee and WiFi Power Boost, and the advanced-solutions ramp inside Business Services. · Open →
Q2 2024 Earnings Call — Q2 FY2024 · 11 pages · The NBA rights-deal rationale, managing the end of the ACP subsidy, and DOCSIS 4.0 / mid-split network progress. · Open →
Q1 2024 Earnings Call — Q1 FY2024 · 11 pages · The NOW prepaid flanker-brand segmentation strategy and the framing of the six scaled growth businesses. · Open →
Q3 2023 Earnings Call — Q3 FY2023 · 28 pages · Peacock scaling toward 28M subs with 2023 flagged as peak losses, and Brian Roberts on why sports anchors the streaming strategy. · Open →
Q3 2021 Earnings Call — Q3 FY2021 · 34 pages · The origin of the convergence thesis — early Xfinity Mobile, the Sky Glass launch, and record post-COVID theme-park profitability. · Open →
Comcast Corporation's annual reports contain management's most considered account of the business. These are the sections, passages and visual pages worth opening in the originals preserved in Sources.
Comcast Corporation — FY2025 Annual Report (Form 10-K) — FY2025
The latest 10-K, filed weeks after the Jan-2026 Versant cable-networks spin-off reshaped the Media segment and the reporting story. · Open the full document →
Item 1: Business — p. 5 · Read the full section →
How Comcast defines itself today — two businesses, five segments — and the Versant spin-off that carved the declining cable networks out.
The business in management's words, and the January 2026 Versant separation.
We are a global media and technology company that reaches customers, viewers and guests worldwide through the connectivity and platforms services we provide and the content and experiences we create. We deliver broadband, wireless, video and voice services primarily under the Xfinity, Comcast Business, Sky and NOW brands; produce, distribute and stream leading entertainment, sports and news through brands including NBC, Telemundo, Universal, Peacock and Sky; and own and operate Universal theme parks. […] On January 2, 2026, we completed the previously announced separation of Versant Media Group, Inc. (“Versant”) into an independent, publicly traded company with its Class A common stock listed on The Nasdaq Stock Market under the ticker symbol “VSNT” (the “Separation”).
p. 5 · Read in context →
Item 1A: Risk Factors — p. 34 · Read the full section →
The two risks most specific to Comcast: the secular decline of linear video, and the Roberts family's non-dilutable control.
Cord-cutting: linear video losses accelerate as consumers shift to streaming.
Changes in consumer behavior continue to adversely affect our businesses and challenge existing business models. […] As consumers increasingly turn to DTC streaming services in lieu of linear video services, which continue to experience accelerated net customer losses, our video customers and video revenues, and linear television network subscriber fees received from video service providers, each decrease.
p. 35 · Read in context →
Item 7: Management's Discussion and Analysis — Overview — p. 52 · Read the full section →
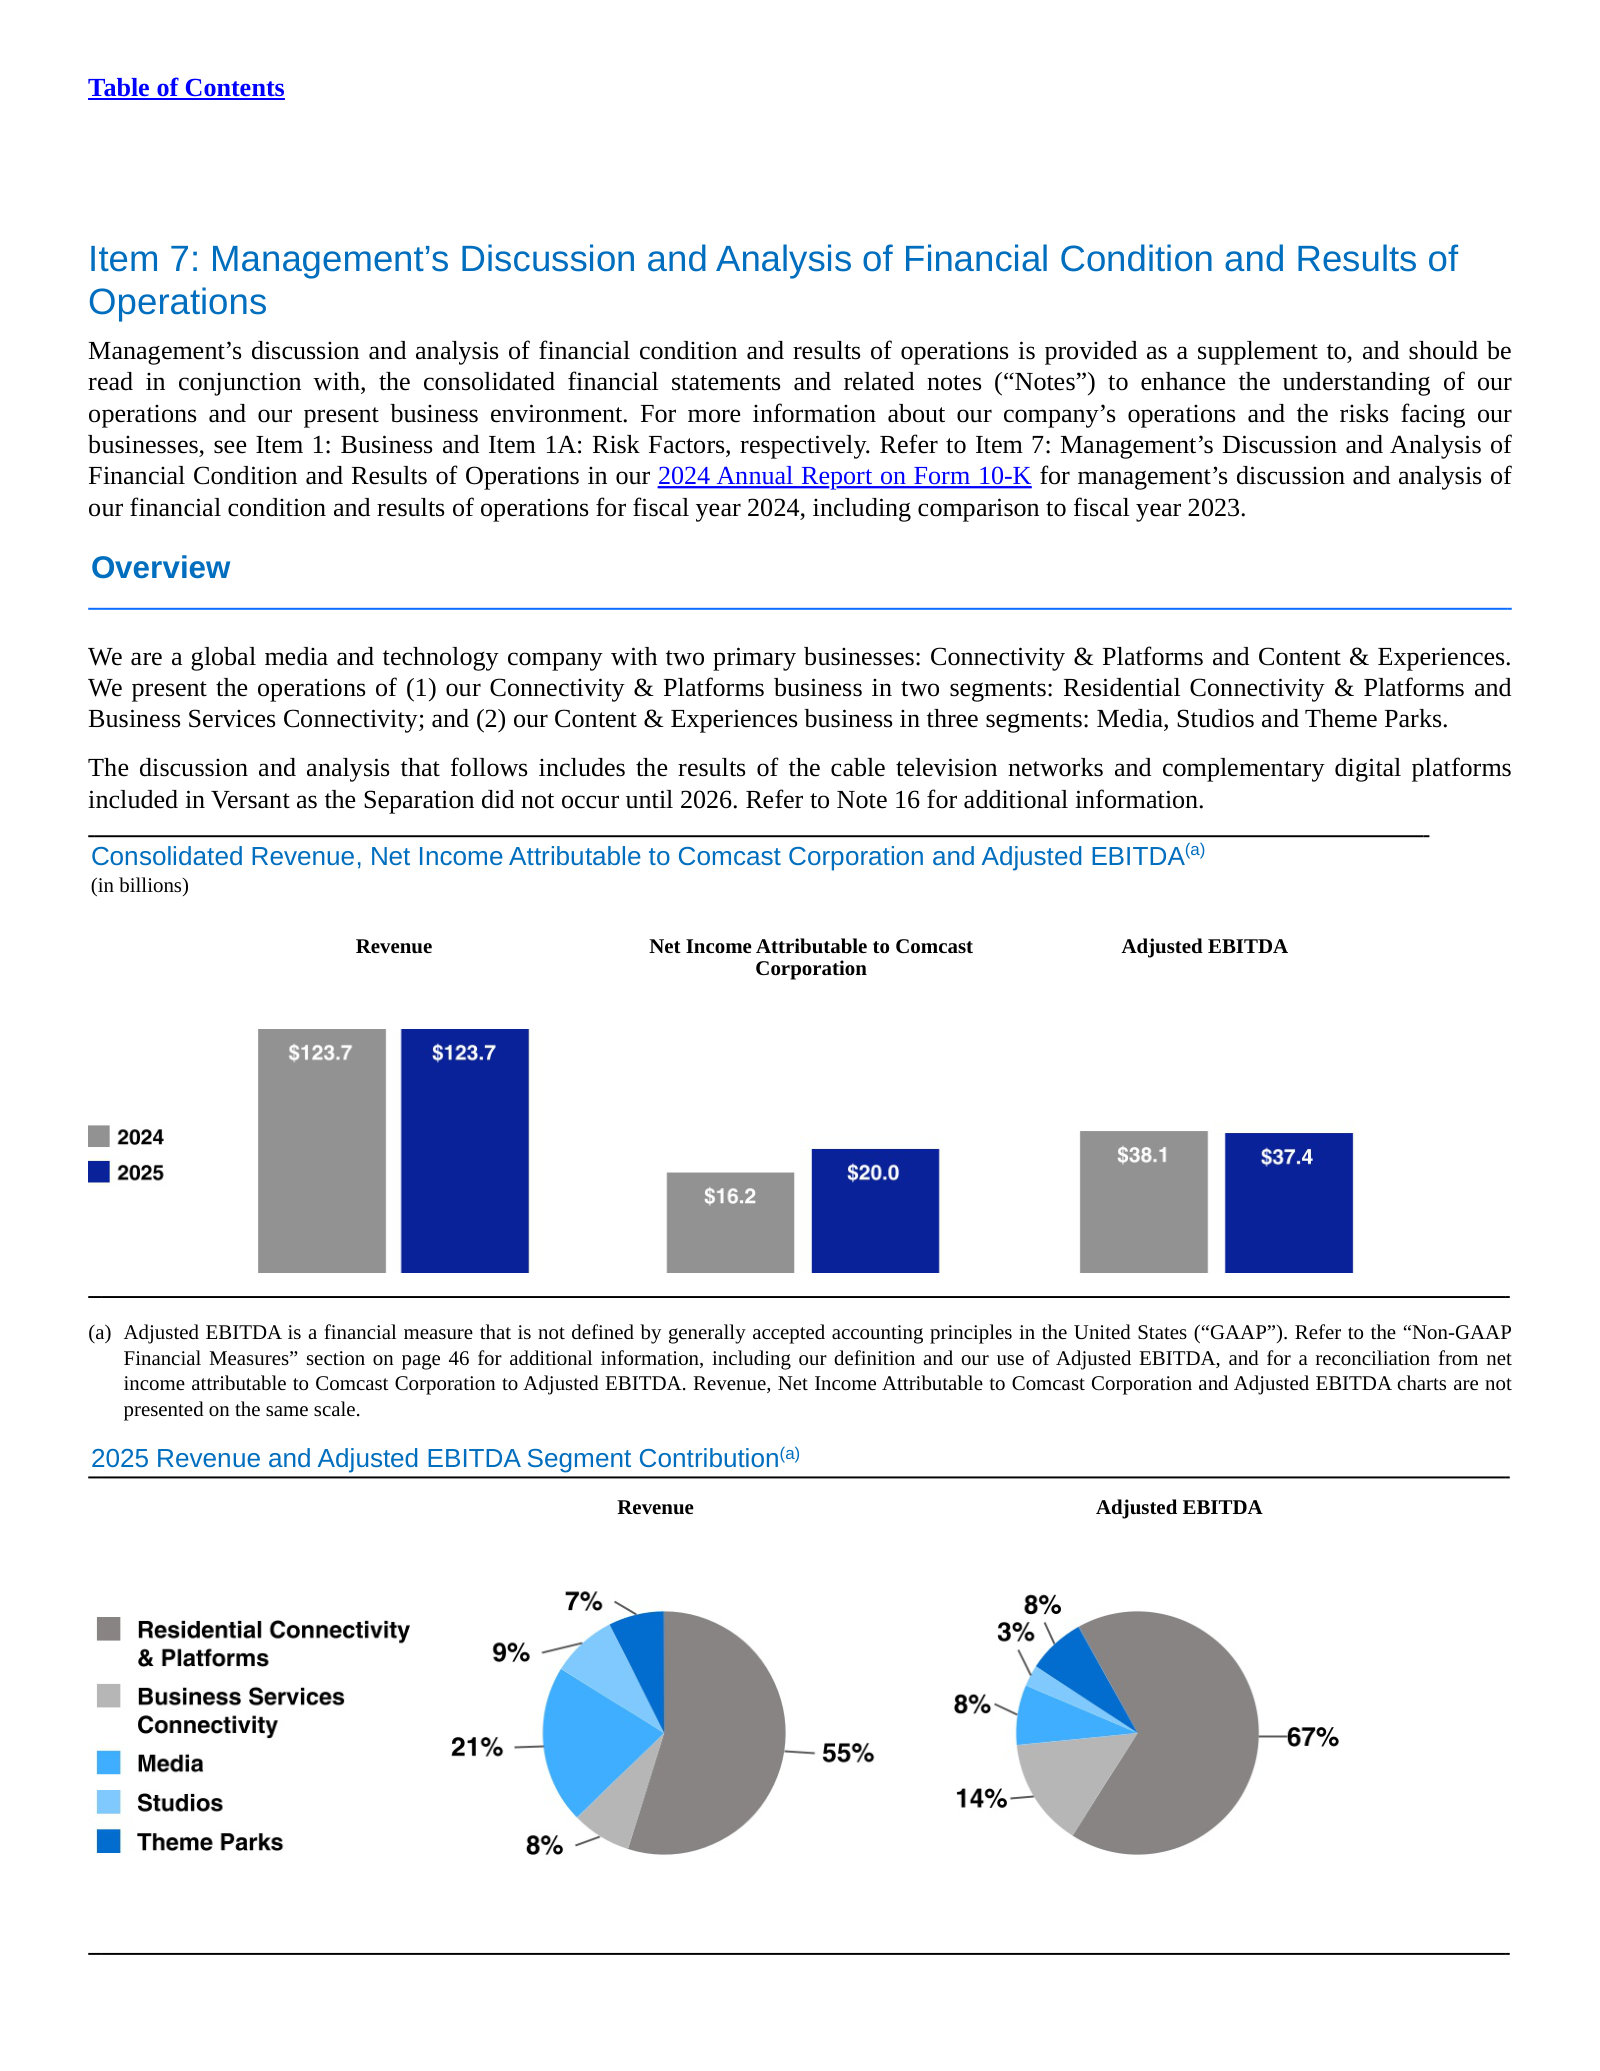
Management's framing of the year: flat $123.7B revenue, net income up to $20.0B, Adjusted EBITDA easing to $37.4B.
The current two-business, five-segment reporting structure.
We are a global media and technology company with two primary businesses: Connectivity & Platforms and Content & Experiences. We present the operations of (1) our Connectivity & Platforms business in two segments: Residential Connectivity & Platforms and Business Services Connectivity; and (2) our Content & Experiences business in three segments: Media, Studios and Theme Parks.
p. 52 · Read in context →
Segment Operating Results — p. 60 · Read the full section →
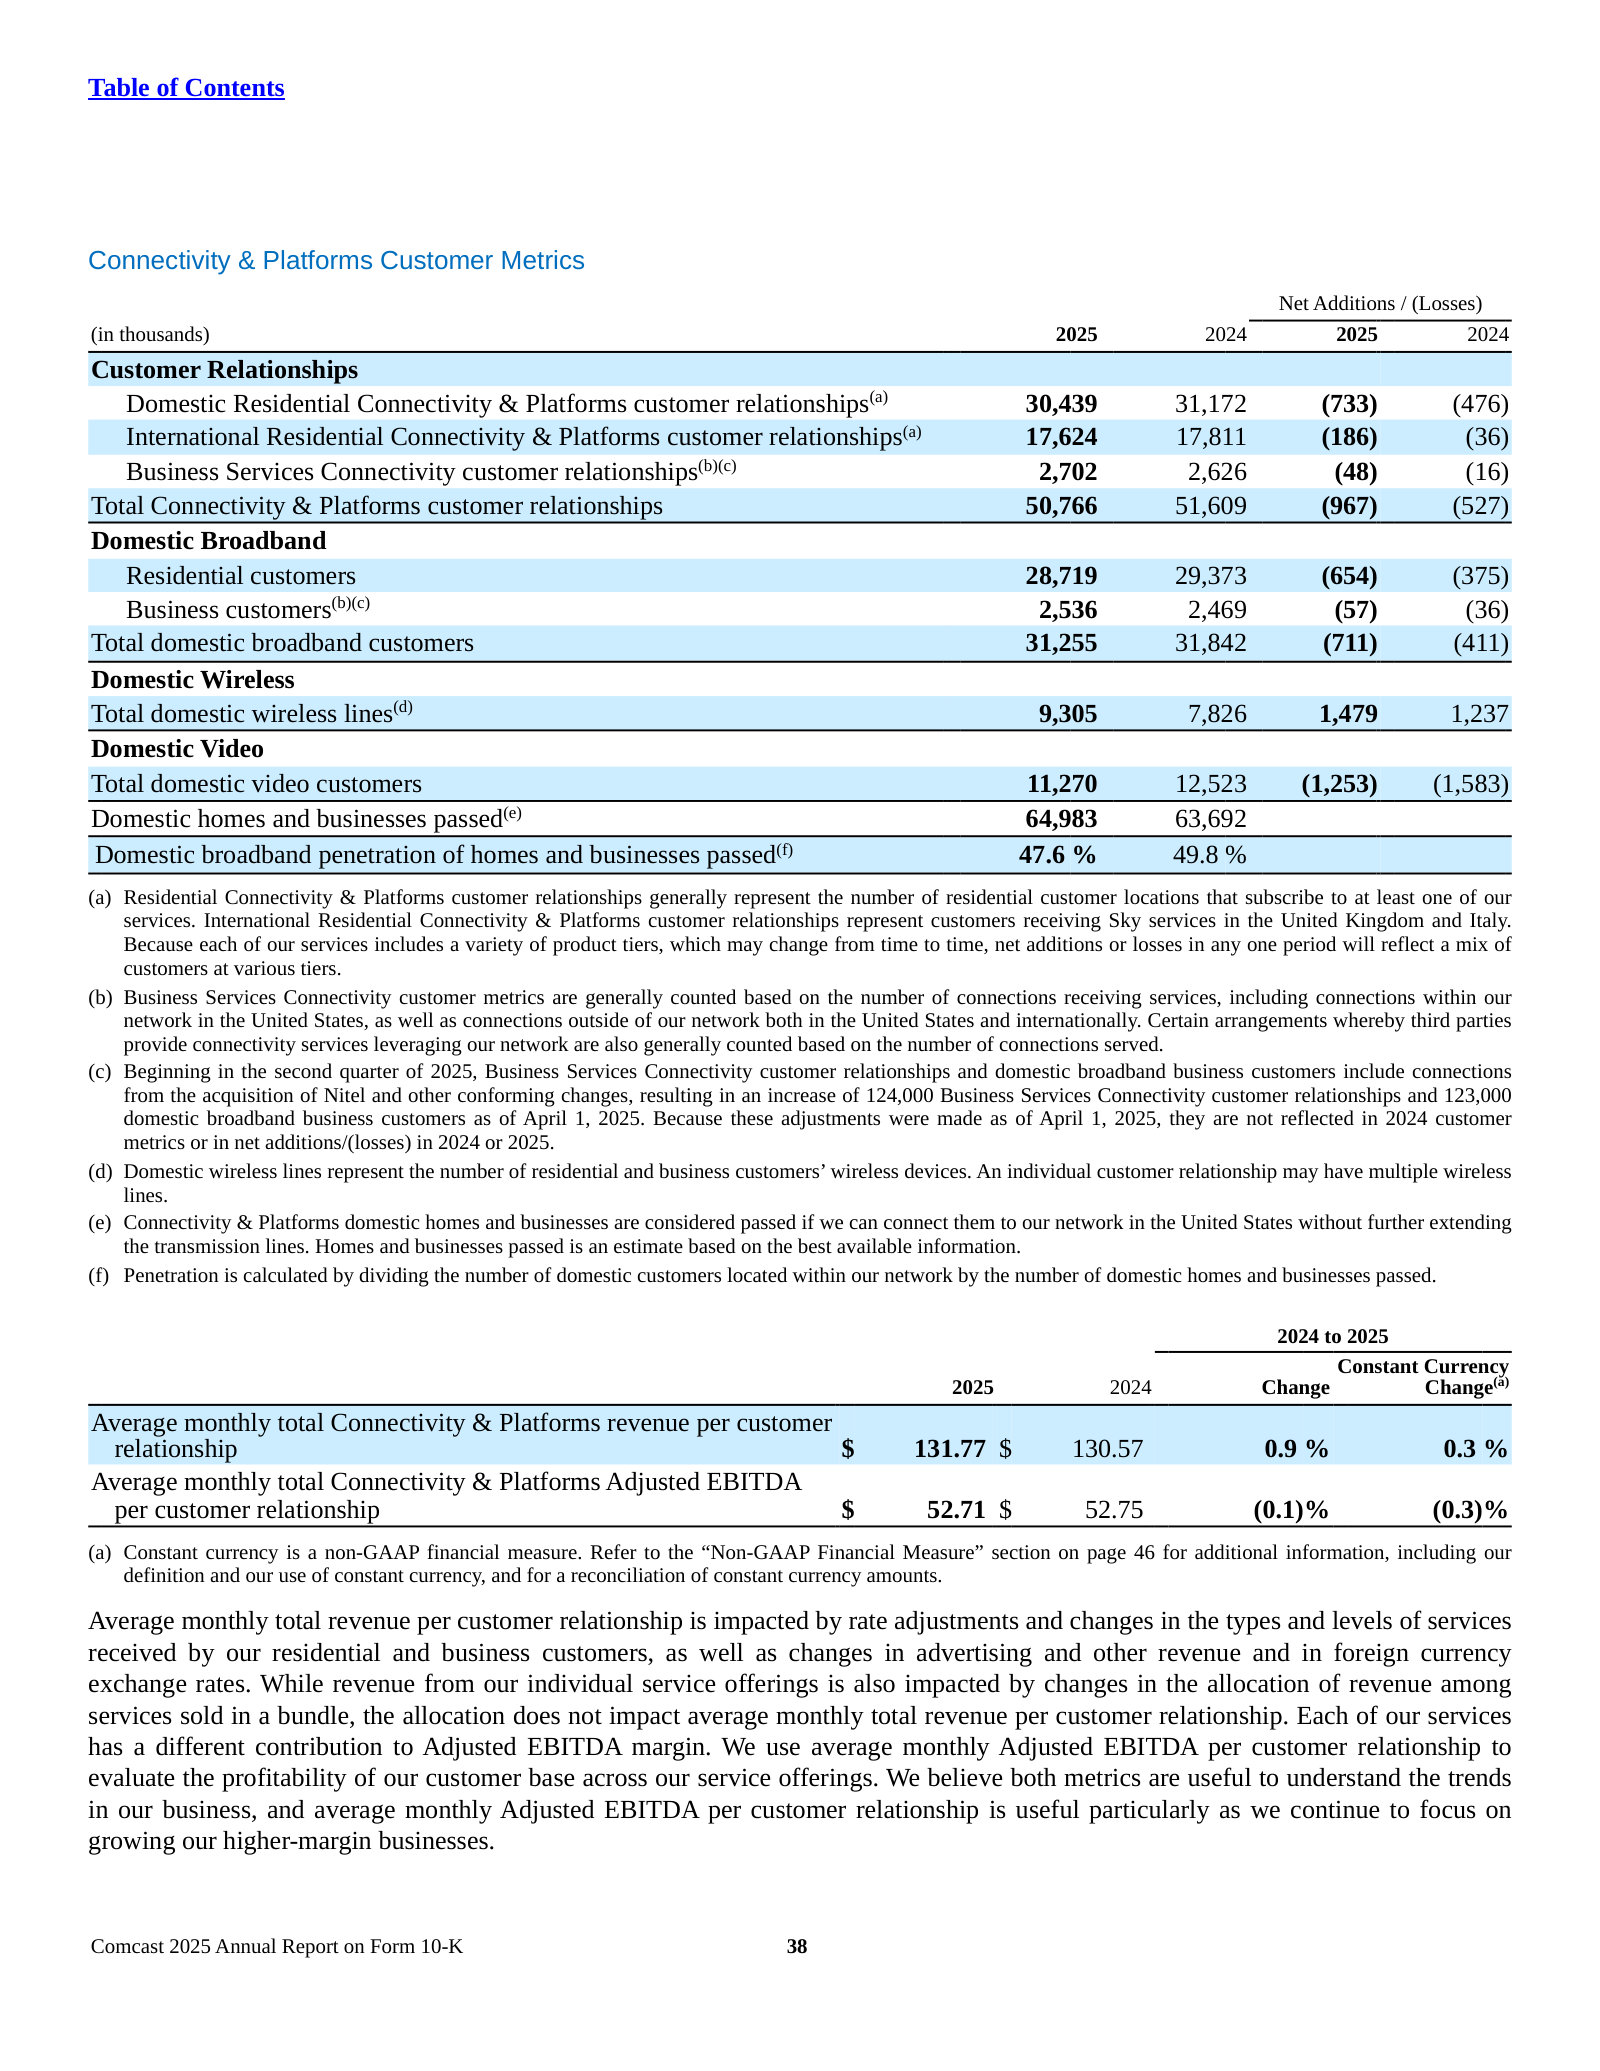
Where the operating truth lives: broadband customer losses against wireless-line and business-services gains.
Management concedes customer relationships hit by an increasingly competitive environment.
We continue to focus on growing our higher-margin connectivity businesses while managing overall operating costs. We also continue to invest in our network to support higher-speed broadband offerings and to expand the number of homes and businesses passed. Our customer relationship additions/(losses) continue to be negatively impacted by an increasingly competitive environment.
p. 60 · Read in context →
Liquidity and Capital Resources — Share Repurchases and Dividends — p. 79 · Read the full section →
The capital-return engine: how much cash went back to shareholders and what authorization remains.
Critical Accounting Estimates — p. 90 · Read the full section →
The judgments that define a cable-and-content balance sheet: goodwill, cable franchise rights, and film/TV cost accounting.
Impairment of goodwill and cable franchise rights, and film/TV costs, are the critical estimates.
We believe our estimates associated with the valuation and impairment testing of goodwill and cable franchise rights and the accounting for film and television costs are critical in the preparation of our consolidated financial statements.
p. 90 · Read in context →
Comcast Corporation — FY2022 Annual Report (Form 10-K) — FY2022
The pre-restructuring company — three businesses (Comcast Cable, NBCUniversal, Sky) — before the 2023 recut Comcast reports under today. · Open the full document →
Item 1: Business — p. 5 · Read the full section →
The old operating map — Comcast Cable / NBCUniversal / Sky — before the 2023 recut into Connectivity & Platforms and Content & Experiences.
The prior three-business, five-segment structure now superseded.
We are a global media and technology company with three primary businesses: Comcast Cable, NBCUniversal and Sky. We were incorporated under the laws of Pennsylvania in December 2001. Through our predecessors, we have developed, managed and operated cable systems since 1963. Through transactions in 2011 and 2013, we acquired NBCUniversal, and in 2018, we acquired Sky. […] We present our operations in five reportable business segments: (1) Comcast Cable in one reportable business segment, referred to as Cable Communications; (2) NBCUniversal in three reportable business segments: Media, Studios and Theme Parks (collectively, the “NBCUniversal segments”); and (3) Sky in one reportable business segment.
p. 5 · Read in context →
More annual reports
Comcast Corporation — FY2024 Annual Report (Form 10-K) — FY2024 · 157 pages · Last 10-K before the Versant spin-off; full-year baseline for the current segment structure. · Open →
Comcast Corporation — FY2023 Annual Report (Form 10-K) — FY2023 · 158 pages · First 10-K under the Connectivity & Platforms / Content & Experiences segment framework. · Open →
Comcast Corporation — FY2021 Annual Report (Form 10-K) — FY2021 · 170 pages · Peak-pandemic broadband year under the old Cable/NBCUniversal/Sky structure. · Open →
Source: S&P Capital IQ consensus via Xpressfeed · Generated 2026-07-25.
Comcast's consensus tape is being marked down: normalized-EPS estimates for FY2027 and FY2028 have fallen roughly 11-13% over the past six months, about three times the ~2-4% cut to revenue, a margin-led downgrade rather than a top-line reset. Yet the company has beaten normalized-EPS consensus for eight straight quarters, so the cuts reflect a lower forward bar, not recent misses. The Street is majority hold, and coverage thins sharply beyond FY2028.
Estimate momentum
Normalized EPS for FY2027 and FY2028 has fallen at every horizon - 30, 90 and 180 days - while revenue has slipped only modestly, so the cut is concentrated in margins.
Currency: USD · Scale: money in millions, absolute · Point-in-time consensus; Δ90d is Now versus 90d.
| Metric | FY | 180d | 90d | 30d | Now | Δ90d |
|---|---|---|---|---|---|---|
| EPS (normalized) | FY2027 | $4.10 | $3.84 | $3.78 | $3.64 | -5.1% |
| EPS (normalized) | FY2028 | $4.53 | $4.25 | $4.17 | $3.96 | -6.9% |
| Revenue | FY2027 | $121.16bn | $120.15bn | $120.16bn | $118.74bn | -1.2% |
| Revenue | FY2028 | $126.85bn | $123.38bn | $123.41bn | $121.86bn | -1.2% |
Eight straight normalized-EPS beats, yet forward EPS keeps getting cut
Current sequences by metric: Revenue: 2 consecutive beats; EPS (normalized): 8 consecutive beats.
Currency: USD · Scale: money in millions, absolute · Consensus is captured before each actual first became effective.
| Quarter | Metric | Consensus | Actual | Surprise | Outcome |
|---|---|---|---|---|---|
| Q2 FY2026 | Revenue | $29.26bn | $29.94bn | +2.3% | Beat |
| Q2 FY2026 | EPS (normalized) | $0.97 | $1.04 | +7.6% | Beat |
| Q1 FY2026 | Revenue | $30.35bn | $31.46bn | +3.6% | Beat |
| Q1 FY2026 | EPS (normalized) | $0.73 | $0.79 | +8.3% | Beat |
| Q4 FY2025 | Revenue | $32.34bn | $32.31bn | -0.1% | Miss |
| Q4 FY2025 | EPS (normalized) | $0.76 | $0.84 | +10.8% | Beat |
| Q3 FY2025 | Revenue | $30.68bn | $31.20bn | +1.7% | Beat |
| Q3 FY2025 | EPS (normalized) | $1.10 | $1.12 | +1.7% | Beat |
| Q2 FY2025 | Revenue | $29.80bn | $30.31bn | +1.7% | Beat |
| Q2 FY2025 | EPS (normalized) | $1.18 | $1.25 | +5.9% | Beat |
| Q1 FY2025 | Revenue | $29.76bn | $29.89bn | +0.4% | Beat |
| Q1 FY2025 | EPS (normalized) | $0.99 | $1.09 | +9.9% | Beat |
| Q4 FY2024 | Revenue | $31.62bn | $31.91bn | +0.9% | Beat |
| Q4 FY2024 | EPS (normalized) | $0.86 | $0.96 | +11.4% | Beat |
| Q3 FY2024 | Revenue | $31.73bn | $32.07bn | +1.1% | Beat |
| Q3 FY2024 | EPS (normalized) | $1.06 | $1.12 | +5.3% | Beat |
The tape prices a FY2026 reset, then a slow climb back
Normalized EPS drops from $4.31 actual in FY2025 to a $3.51 FY2026 trough, then rebuilds to $4.25 by FY2029; revenue hovers near $120bn throughout.
Currency: USD · Scale: money in millions, absolute · YoY uses the prior fiscal year from the feed; analyst count and range use the first displayed period.
| Metric | FY2025A | FY2026E | FY2027E | FY2028E | FY2029E | YoY | Analysts | Low / high |
|---|---|---|---|---|---|---|---|---|
| Revenue | $123.70bn | $120.74bn | $118.74bn | $121.86bn | $120.06bn | — | 26 | $123.12bn / $124.20bn |
| EBITDA | $37.38bn | $33.21bn | $33.44bn | $34.08bn | $34.16bn | — | 26 | $36.99bn / $37.78bn |
| EPS (normalized) | $4.20 | $3.51 | $3.64 | $3.96 | $4.25 | — | 25 | $3.93 / $4.30 |
Normalized-EPS dispersion widens as coverage thins into the outer years
FY2027 normalized EPS spans $3.19-$4.23 across 20 analysts; by FY2029 the range is $3.25-$5.30 on just seven, so the outer-year mean is far less firm.
Currency: USD · Scale: money in millions, absolute · Spread/mean is absolute high-low divided by absolute mean.
| Metric | Period | Mean | Low–high | Spread/mean | Analysts |
|---|---|---|---|---|---|
| EPS (normalized) | FY2027E | $3.64 | $3.19–$4.23 | 28.5% | 20 |
| EPS (normalized) | FY2028E | $3.96 | $3.28–$4.81 | 38.7% | 13 |
| EPS (normalized) | FY2029E | $4.25 | $3.25–$5.30 | 48.2% | 7 |
Majority-hold Street, targets from $21 to $44
Sixteen analysts rate Comcast hold against eight buys, and the 22 price targets span $21 to $44 around a $31 mean; with no current price in this feed, no upside is implied.
Currency: USD · Scale: money in millions, absolute · Analyst counts shown explicitly.
| Street view | Reading | Analysts |
|---|---|---|
| Recommendation mix | Buy 8, Outperform 1, Hold 16, Underperform 1, Sell 2 | 28 |
| Consensus score | 2.57 | 28 |
| Target price | mean $30.58; median $30.00; high $44.00; low $21.00 | 22 |
Outer-year coverage thins to a handful of analysts
By FY2029 revenue and normalized EPS carry just seven analysts and GAAP net income only five, versus 25-plus on the current year; treat outer-year figures as indicative.
Visible Alpha broker models via S&P Xpressfeed · 23 brokers · 520 line items · freshest revision 2026-07-24.
Comcast's broker models depict a business in slow rotation: total revenue hovers near $120bn through FY-2028 while the mix shifts underneath. A shrinking domestic broadband-and-video core is offset by wireless, Peacock and theme parks. The sharpest modeled inflection is Peacock, where streaming EBITDA is penciled to cross into profit in FY-2027.
Wireless, Peacock and parks now offset a shrinking broadband-and-video core
| Line | FY-2025A | FY-2026E | FY-2027E | FY-2028E | YoY | Brokers |
|---|---|---|---|---|---|---|
| Fading | — | — | — | — | — | — |
| Domestic broadband revenue | $25.84bn | $25.00bn | $24.69bn | $24.63bn | -3.2% | 21 |
| Video platform revenue | $26.42bn | $24.26bn | $22.81bn | $21.60bn | -8.2% | 21 |
| Growing | — | — | — | — | — | — |
| Domestic wireless revenue | $4.90bn | $5.87bn | $6.70bn | $7.53bn | +19.8% | 21 |
| Streaming - Peacock revenue | $5.49bn | $7.90bn | $8.74bn | $9.78bn | +43.8% | 18 |
| Theme parks revenue - C&E | $9.78bn | $10.37bn | $10.98bn | $11.56bn | +6.1% | 21 |
Peacock flips to profit: streaming EBITDA turns positive in FY-2027
| Line | FY-2025A | FY-2026E | FY-2027E | FY-2028E | YoY | Brokers |
|---|---|---|---|---|---|---|
| Streaming EBITDA - Peacock | $-995.76m | $-216.74m | $273.63m | $761.37m | +78.2% | 18 |
| Blended ARPU - Peacock($) | $10.81 | $13.74 | $14.39 | $15.52 | +27.1% | 6 |
| Ending paid subs - Peacock(K#) | 42.84m Number | 49.34m Number | 52.06m Number | 54.30m Number | +15.2% | 18 |
| Net adds - Paid subs - Peacock(K#) | 6.78m Number | 5.33m Number | 2.72m Number | 2.24m Number | -21.4% | 17 |
Convergence math: wireless line adds outrun broadband and video losses
| Line | FY-2025A | FY-2026E | FY-2027E | FY-2028E | YoY | Brokers |
|---|---|---|---|---|---|---|
| Total domestic wireless line net additions (losses)(K#) | 1.51m Number | 1.70m Number | 1.54m Number | 1.43m Number | +12.4% | 21 |
| Total domestic broadband net additions (losses)(K#) | -657,372 Number | -484,850 Number | -389,469 Number | -367,993 Number | +26.2% | 18 |
| Total domestic video net additions (losses)(K#) | -1.26m Number | -1.07m Number | -923,927 Number | -783,384 Number | +15.2% | 18 |
Brokers split on Peacock's profit turn and how deep broadband bleeds
| Line | Period | Median | Q1–Q3 | Min–max | Brokers |
|---|---|---|---|---|---|
| Streaming EBITDA - Peacock | FY-2027E | $436.08m | $144.98m–$493.72m | $-406.02m–$606.49m | 11 |
| Domestic broadband residential net additions (losses)(K#) | FY-2027E | -460,000 Number | -520,000 Number–-400,000 Number | -610,000 Number–-97,250 Number | 9 |
| Total domestic video net additions (losses)(K#) | FY-2027E | -924,000 Number | -1.05m Number–-800,000 Number | -1.12m Number–-710,870 Number | 9 |
Segment detail thins to a handful of brokers in the out-years
Headline P&L is well covered (20+ brokers), but NBCUniversal segment EBITDA falls to a single broker by FY-2027 and Sky to three, so treat those breakouts as one or two analysts' views rather than consensus. Vintage is not the concern — consensus was last refreshed 2026-07-24.
Headline P&L consensus, momentum and beat/miss live in the CapIQ tab.
Source: S&P Capital IQ transcripts via Xpressfeed · latest indexed call 2026-07-23 · generated 2026-07-25.
Latest call digest
Comcast Corporation, Q2 2026 Earnings Call, Jul 23, 2026 · 2026-07-23T12:30:00
Q2 2026 — reported July 23, 2026. The prepared remarks were dominated by the separation Comcast announced three weeks earlier — a plan to split into two companies (Connectivity & Platforms and a media/entertainment company with NBCUniversal and Sky), targeted for completion in about a year, with Michael Angelakis returning. Management struck an upbeat tone: wireless crossed 10 million lines for the first time with a record 448,000 net additions, Peacock reached its first profitable quarter ($189 million of EBITDA) and added 2 million subscribers to reach 48 million, and the Studios slate (The Odyssey, Minions & Monsters, Obsession) was highlighted. Sky's proposed acquisition of ITV's media business was also flagged.
The financial reality was softer: revenue rose 5% but adjusted EBITDA declined 5%, weighed by the broadband go-to-market pivot and the final quarter of first-year NBA rights costs. Adjusted EPS was $1.04 and free cash flow was $4.6 billion, of which $2.1 billion was returned to shareholders including $900 million of buybacks. Broadband losses improved to 167,000 (a 34,000 year-over-year improvement) but ARPU fell 3.8% and Connectivity & Platforms EBITDA declined 5.8%.
The Q&A — pre-collected questions read by IR rather than a live queue — surfaced the harder issues. Management flagged that Parks softened more than anticipated, with Orlando attendance weakening since June even as Epic performs to plan. Analysts pressed on Starlink/satellite as an emerging competitor and on separation mechanics; on the latter, management declined to add detail beyond the announcement. The clearest guidance stated: modest C&P improvement expected starting in the third quarter, a significant majority of free wireless lines expected to convert to paid as roll-offs accelerate in the second half, and share repurchases paused as of July 1 through the separation.
Participant coverage from the latest call.
| Group | Participants | Count |
|---|---|---|
| Management | Operator; Marci Ryvicker — Executive Vice President of Investor Relations, Comcast Corporation; Brian Roberts — Chief Executive Officer, President, Director and Director of Comcast Cable Communications Inc, Comcast Holdings Corporation; Michael Cavanagh — Co-CEO & Director, Comcast Corporation; Jason Armstrong — Chief Financial Officer, Comcast Corporation; Steven Croney — Chief Executive Officer of Connectivity & Platforms Division, Comcast Corporation | 6 |
| Analysts | Not supplied |
Curated latest-call exchanges; one row per analyst topic.
| Analyst | Firm | Topic | What changed in Q&A |
|---|---|---|---|
| John Hodulik | UBS | Broadband competitive dynamics | Opened on competition; management reiterated fiber, fixed wireless and now satellite intensity, leaning on converged ARPA (~$85) and a wire-into-the-home advantage. |
| Craig Moffett | MoffettNathanson | Starlink / satellite threat and partnerships | Two-part question (with New Street) on whether Starlink is rural-only or 'FWA 2.0' and on partnership interest; management said Starlink is not yet a meaningful competitor but expects it to become one over time, mainly in rural areas. |
| Steve Cahall | Wells Fargo | Whether ARPU and C&P EBITDA pressure abates in H2 | Directly tested prior guidance; management held to modest improvement beginning in the third quarter as free lines convert and early investments are lapped. |
| Mike Ng | Goldman Sachs | Domestic Parks softness since June | Multi-part (with Evercore and UBS) on attendance versus per-cap and Epic versus the rest of Orlando; management attributed softness to attendance, tied it to consumer sentiment and travel costs, and separated it from Epic, which is performing to plan. |
| Kutgun Maral | Evercore | Durability of Peacock profitability | Asked whether the profit inflection is durable; management said to view profitability annually rather than quarterly given sports and content timing, and expects continued annual improvement. |
| Sebastiano Petti | JPMorgan | Separation leverage, dividend policy and exchange ratio | Asked for target leverage, dividend policy and an exchange-ratio timeline; management deferred, saying there was nothing to add beyond the announcement three weeks earlier. |
| Jessica Reif Ehrlich | BofA | Whether NBCUniversal has scale to compete independently | Probed whether separation is about consolidation currency; management argued the asset mix already has the heft to compete and to partner as an independent. |
Theme tracker
Themes are curator-classified across supplied calls.
| Theme | Status | Quarters mentioned | Read-through |
|---|---|---|---|
| Broadband go-to-market pivot (simplified pricing, 5-year guarantee) | persisted | Q3 2025, Q4 2025, Q1 2026, Q2 2026 | Management's largest-ever go-to-market shift; deliberately dilutive to broadband ARPU and C&P EBITDA and framed as an investment period to stabilize the base before returning to growth. |
| Wireless convergence and free-line monetization | persisted | Q4 2025, Q1 2026, Q2 2026 | Record net additions in consecutive quarters (435,000 in Q1 2026, 448,000 in Q2 2026); the planned conversion of free lines to paid in the second half of 2026 is the central monetization catalyst. |
| Peacock path to profitability | persisted | Q4 2025, Q1 2026, Q2 2026 | Losses narrowed steadily and Peacock reached its first profitable quarter ($189 million of EBITDA) in Q2 2026; management frames profitability on an annual rather than quarterly basis. |
| NBA rights dilution | persisted | Q4 2025, Q1 2026, Q2 2026 | First-year straight-lined amortization peaked in Q1 2026, and Q2 2026 was the final quarter of the first contract year; a drag management expects to lap as advertising and subscriber monetization build. |
| Theme Parks and Epic Universe | persisted | Q4 2025, Q1 2026, Q2 2026 | Epic drove strong Orlando growth through early 2026, but Q2 2026 flagged broader Orlando attendance softening since June — a notable reversal after several quarters of unqualified strength. |
| Corporate separation and portfolio restructuring | emerged | Q2 2026 | Following the January 2026 Versant spin, management announced a full separation of Comcast into two companies targeted for completion in about a year; a new and dominant theme. |
| Affordable Connectivity Program (ACP) wind-down | dropped | Q1 2024, Q2 2024, Q3 2024 | A recurring 2024 headwind to broadband subscribers that has since disappeared from management commentary, consistent with the program's wind-down. |
Guidance ledger
Quotes, calls, and speakers are source-verified; outcomes are curator-classified.
| Verbatim guidance | Call | Speaker | Curator outcome | Outcome note |
|---|---|---|---|---|
| “putting Peacock on track to approach profitability for the first time next quarter” | Comcast Corporation, Q1 2026 Earnings Call, Apr 23, 2026 · 2026-04-23T12:30:00 | Michael Cavanagh | kept | Q2 2026 Peacock reached profitability, generating $189 million of EBITDA. |
| “we expect incremental EBITDA pressure over the next couple of quarters until we begin to lap these initial investments in the second half of 2026” | Comcast Corporation, Q4 2025 Earnings Call, Jan 29, 2026 · 2026-01-29T13:30:00 | Jason Armstrong | pending | C&P EBITDA fell 4.7% in Q1 2026 and 5.8% in Q2 2026; the expected second-half 2026 improvement had not yet arrived by the July 2026 call. |
| “we expect to convert the significant majority of free lines into paying relationships, which should provide a tailwind to convergence revenue and ARPA growth over time” | Comcast Corporation, Q1 2026 Earnings Call, Apr 23, 2026 · 2026-04-23T12:30:00 | Jason Armstrong | pending | In Q2 2026 management said early free-line conversion cohorts were tracking in line with expectations, with roll-offs accelerating in the second half of 2026. |
| “we expect modest improvements starting in the third quarter” | Comcast Corporation, Q2 2026 Earnings Call, Jul 23, 2026 · 2026-07-23T12:30:00 | Jason Armstrong | pending | Refers to Q3 2026, which falls outside the supplied call history. |
| “we did pause share repurchases as of July 1 and expect to remain paused through our separation” | Comcast Corporation, Q2 2026 Earnings Call, Jul 23, 2026 · 2026-07-23T12:30:00 | Jason Armstrong | pending | Separation targeted for completion in approximately one year; a buyback resumption date was not given. |
Q&A pressure map
Question counts and firms are curator tallies; analyst coverage shown above.
| Topic | Questions | Firms | Pressure / response |
|---|---|---|---|
| Broadband ARPU and C&P EBITDA trajectory | 8 | MoffettNathanson, UBS, Citigroup, Goldman Sachs, Wells Fargo | The most-pressed topic across recent calls; analysts repeatedly tested how far ARPU must fall and when EBITDA declines reverse, with management consistently pointing to second-half 2026 relief. |
| Wireless free-line monetization | 4 | Citigroup, Goldman Sachs, Wolfe Research | Analysts pushed on conversion economics and the confidence behind converting free lines to paid; management pointed to early cohorts tracking in line and lifecycle management. |
| Satellite / Starlink as an emerging competitor | 3 | MoffettNathanson, New Street, Morgan Stanley | A newer line of questioning; management said satellite is not yet meaningful but expects it to become more competitive, mainly in rural and underserved areas. |
| Parks demand softness | 3 | Goldman Sachs, Evercore, UBS | Analysts sought to separate attendance from per-cap and Epic from the rest of Orlando; management acknowledged attendance-driven softness since June while defending the long-term model. |
| Separation capital structure and exchange ratio | 1 | JPMorgan | The specific request for target leverage, dividend policy and an exchange-ratio timeline went unanswered; management said only that there was nothing to add beyond the announcement, so the numeric detail sought was not provided. |
Language shifts
Only language evidence verified against the referenced component is shown.
| Observation | Verbatim evidence | Call ID | Component |
|---|---|---|---|
| The separation is a new and dominant topic, absent from all prior calls in the supplied history and placed at the very top of the latest call. | “I'd like to spend a few minutes on the separation we announced 3 weeks ago” | 2005553141 | 2 |
| New caution on Parks after several quarters of describing Orlando as performing well; management explicitly conceded conditions were worse than expected. | “The operating environment has softened more than we anticipated” | 2005553141 | 3 |
| A confidence marker on broadband in early 2026: the first year-over-year net-loss improvement in more than five years. | “the first year-over-year improvement since the fourth quarter of 2020” | 1989452648 | 3 |
| Satellite (Starlink) is newly named as a competitor to watch, a category not featured in earlier-year calls even as management downplays its current impact. | “We fully expect to see them as more of a competitor over time” | 2005553141 | 8 |
The call history shows a company deliberately trading near-term broadband ARPU and NBA-related margin for a simpler pricing model, a fast-scaling wireless base and a now-profitable Peacock. The July 2026 decision to separate into two companies and pause buybacks is the defining new variable, and softening Parks demand is the freshest downside surprise; the investment case now hinges on whether the promised second-half 2026 improvement and free-line monetization actually land.
Competitors describe Comcast Corporation's market in their own filings and calls. These verified passages and visual pages show where their strategies meet, using source documents preserved in Sources.
Charter Communications (CHTR)
Comcast's structural mirror image: the other large US cable operator running the same broadband-video-plus-MVNO model. The two do not overlap geographically and even partner (Xumo, seamless Wi-Fi), but Charter benchmarks itself against Comcast's subscriber trajectory and mobile economics on nearly every call and sizes the same converged-connectivity opportunity.
Charter's CEO responds to an analyst on Comcast's reported broadband and mobile inflection, noting the two cable operators have no geographic overlap and partner on technology and platforms rather than competing head-to-head for the same customers.
Steve Cahall, Analyst (Wells Fargo), question; Chris Winfrey, President and CEO, answer: Chris, yesterday, Comcast reported a pretty strong inflection in their subscriber trends. It came on the back of a huge quarter for event marketing, and they've been pretty aggressive lately on ARPU and price locks as well. […] Sure. First off, you should note that we were pleased — great to see the change in trajectory for Comcast and their Internet success and mobile. We don't have any overlap with Comcast, and we partner with them on many fronts from a technology and platform perspective, so we're cheering them on. I think it's good for everybody. They may be coming from a different place and timing. As of yesterday, our team has already started to see if there are any good nuggets that might work for us and whether we could adopt them. So far, we haven't seen anything we need to copy, but we're open-minded.
p. 11 · Read in context →
Charter's stated sizing of the converged connectivity market it will address after the Cox acquisition closes: ~70 million passings, ~37 million customers and roughly $67 billion of revenue pro forma, with only 8% of the ~164 million mobile lines in its footprint on Spectrum Mobile today — the same cable convergence playbook Comcast runs with Xfinity.
Christopher Winfrey, President and CEO: Following the closing of the Cox transaction, I want to frame what we'll represent as an industry partner for innovation. We'll have roughly 1.3 million miles of network with over 70 million passings with a fully converged multi-gig Internet and mobile offering available to all of those passings. We'll have approximately 37 million customers, meaning a selling opportunity of nearly 35 million passings without a relationship today. Together, we'll generate approximately $67 billion in revenue and approximately $28 billion in EBITDA. Spectrum will operate under two MVNOs with the best mobile networks in the country and the only fully converged capability in our footprint. Today, there are approximately 164 million mobile lines in our footprint and only 13 million of those will be Spectrum Mobile, 8% penetration with a faster, lower-cost mobile product. So while we're growing mobile quickly, there's still a very large growth opportunity in front of us.
p. 2 · Read in context →
Prompted by an analyst on Comcast's disclosed 90% Wi-Fi offload rate, Charter's CEO benchmarks its own offload at 88-89% via Wi-Fi, seamless authentication across the major cable footprints and CBRS — the shared economics of the cable MVNO model that underpins both Spectrum Mobile and Xfinity Mobile.
Christopher Winfrey, President and CEO: The second question you asked, Craig, was around wireless. I hadn't seen that Comcast has reported up at 90%. We've been at 88%, and we were moving up to 89% through exactly the same reasons, which was the continued offload that we have through WiFi, through seamless authentication, not only in our footprint, but in Comcast and also in the Cox footprint as well across the three major cable operators. And in addition to that, the continued rollout of CBRS.
p. 7 · Read in context →
T-Mobile US (TMUS)
The most aggressive attacker of Comcast's broadband franchise: T-Mobile's 5G Home Internet and new fiber JVs are pulled directly from the cable base, and it names Comcast as a wireless competitor in its 10-K. It is also a spectrum counterparty, buying 600 MHz licenses from Comcast.
T-Mobile's 10-K Competition section names Comcast Corporation among its wireless competitors and lists Cable and Fiber broadband providers as competitors to its own broadband service — putting Comcast on both sides of T-Mobile's competitive map.
We are the second largest provider of wireless communications services in the U.S. as measured by our total postpaid and prepaid customers. Our wireless communications services competitors include other carriers, such as AT&T Inc. (“AT&T”) and Verizon Communications, Inc. (“Verizon”). In addition, our wireless communications services competitors include numerous smaller and regional providers, including Charter Communications, Inc., Comcast Corporation, EchoStar Corporation (“EchoStar”), Cox Communications, Inc., and Altice USA, Inc., many of which offer no-contract, postpaid and prepaid service plans. […] In addition to our wireless communications services, our broadband services compete against other broadband providers, including Cable, DSL and other Fiber broadband providers, other fixed wireless solutions, including AT&T and Verizon’s fixed wireless products, and satellite internet providers.
p. 8 · Read in context →
Asked about 'the cable story,' T-Mobile's CEO says cable is not a business it wants to own and frames its strategy as attacking incumbents through fiber and fixed wireless — the posture behind its home-internet push against cable broadband providers like Comcast.
Srinivasan Gopalan, President and CEO: Kannan, it just struck me that your reference to large deals potentially was you asking the question I get asked quite often, which is the cable story. As I've said before, we're not going to go do scale for scale's sake. Specifically, cable is not something we're interested in. We see our strength as attacking incumbents rather than becoming an incumbent. We see a huge opportunity to attack incumbents across fiber and fixed wireless access. That will be our key play.
p. 8 · Read in context →
Verizon Communications (VZ)
A coopetitor on two fronts: Comcast's Xfinity Mobile is an MVNO on Verizon's wireless network (just renewed), while Verizon's Fios and fixed-wireless broadband — enlarged by the Frontier fiber acquisition — compete head-on with Xfinity for home-internet subscribers and push the same convergence bundle.
Verizon's CEO confirms a renewed long-term wholesale agreement with Comcast and Charter — the MVNO relationship under which Xfinity Mobile and Spectrum Mobile run on Verizon's network, the coopetition that sits alongside Verizon's broadband rivalry with Comcast.
Daniel Schulman, Chief Executive Officer: I'm also very pleased to announce that we have completed a comprehensive long-term agreement with Comcast and Charter to continue our partnership. We obviously can't reveal any of the details, but each of us agrees the partnership is on very solid footing financially, operationally, and strategically. It is an accretive deal that ensures their customers remain on the best network.
p. 2 · Read in context →
Verizon claims broadband share gains of 348,000 net adds in the quarter to over 17.1 million subscribers, split across fixed wireless (193,000) and fiber (155,000) — the FWA-plus-Fios base competing directly for Comcast's Xfinity broadband customers.
Anthony Skiadas, Chief Financial Officer: We continue to take share in broadband with 348,000 net additions in the quarter. Notably, we now have over 17.1 million total broadband subscribers in our base. Fixed wireless access and fiber delivered net adds of 193,000 and 155,000, respectively, demonstrating our continued success in capturing our broadband opportunity with both technologies.
p. 4 · Read in context →
Verizon positions fiber as a differentiator against competitors that lack it and cites a best-in-industry 55% wireless attach rate on broadband households — the convergence-bundle argument aimed at cable operators such as Comcast.
Daniel Schulman, Chief Executive Officer: In Q1, we continue to take broadband share. We have absolutely no intention to slow down; in fact, quite the opposite. […] There's no question we think that fiber is a key differentiator against competitors who don't have it. And I'd also point out that our attachment rate of wireless when a customer has broadband is, I think, best in the industry at 55% right now.
p. 9 · Read in context →
AT&T (T)
AT&T's fiber-and-fixed-wireless build plus its OneConnect convergence bundle attack the same converged broadband-and-mobile customer Comcast targets. Management repeatedly frames cable — naming Comcast — as priced higher with an inferior product, and quantifies fiber's share gains.
Naming Comcast and Charter, AT&T's CEO argues it 'sits under their pricing umbrella' with a lower-priced, better-performing fiber product, and that cable — priced higher — is the party having to readjust to the market.
Peter Supino, Analyst (Wolfe Research), question; John Stankey, Chairman and CEO, answer: Comcast and Charter are behaving differently in terms of the way they price existing customer broadband rates. And so I'm wondering how you're thinking about the price of fiber for your existing subs, your retail rate outlook? […] Look, I've said it before, I think we're in a distinctly different place in cable. One is we currently sit under their pricing umbrella. We're not at their levels. So we have a lot more degrees of freedom in how we manage our ARPUs and our various offers in the market than they have. So it's one thing, understand why they're having to make the changes they're making; they're priced higher and their products are inferior. And so they're the ones that are having to readjust to the market, not us. We've got the better product, we're priced lower. And that's why this is a problem for them.
p. 9 · Read in context →
AT&T quantifies its fiber-plus-wireless convergence: over 41% of fiber households and more than half of Internet Air (fixed-wireless) subscribers also take AT&T wireless — the bundling motion that competes with Comcast's Xfinity broadband-plus-mobile convergence.
John Stankey, Chairman and CEO: Today, more than 41% of AT&T Fiber households also choose AT&T Inc. for wireless. The pace of this convergence trend within our customer base continues to grow. These customers remain our most valuable, with the lowest churn profile and highest lifetime values. Our success with convergence also extends to fixed wireless. More than half of our Internet Air subscribers also choose AT&T Inc. for their wireless service.
p. 1 · Read in context →
AT&T reports 273,000 fiber and 239,000 Internet Air (fixed-wireless) net adds and an ~8 million-location fiber expansion for 2026 — the pace of AT&T's broadband build into territory where cable operators like Comcast compete for the same homes.
Pascal Desroches, Chief Financial Officer: This was our best ever first quarter, and included 273,000 fiber net adds and 239,000 Internet Air net adds. We continue to expect that our fiber reach will grow by about 8 million locations in 2026, including over the many new locations we acquired from Lumen.
p. 4 · Read in context →
The Walt Disney Company (DIS)
The primary rival to Comcast's Content & Experiences segment: Disney+/Hulu versus Peacock in streaming, and Walt Disney World versus Universal's new Epic Universe in Florida theme parks. The two are also financially entangled through the NBCUniversal-Hulu buyout.
Disney's 10-K documents the buyout of Comcast/NBCUniversal's 33% Hulu stake at a $27.5 billion guaranteed floor — $8.6 billion paid in 2023 plus an incremental $0.4 billion in fiscal 2025 — the transaction that removed NBCUniversal from Hulu as Comcast concentrates its streaming behind Peacock.
NBC Universal (NBCU) exercised its right to require the Company to purchase NBCU’s 33% interest in Hulu at a redemption value based on NBCU’s equity ownership percentage of the greater of Hulu’s equity fair value or a guaranteed floor value of $27.5 billion. In December 2023, the Company paid NBCU $8.6 billion, which reflected the guaranteed floor value less NBCU’s unpaid capital call contributions. […] In fiscal 2025, following the completion of an appraisal process to determine Hulu’s equity fair value, the Company paid NBCU an incremental $0.4 billion, reflecting NBCU’s share of Hulu’s equity fair value above the guaranteed floor, giving the Company 100% ownership of Hulu.
p. 94 · Read in context →
Disney names Comcast/NBCUniversal's new Epic Universe park in Orlando as an event its domestic parks are lapping, expecting attendance to improve versus a 1% Q2 decline — a direct reference to the Universal park competing with Walt Disney World.
Josh D'Amaro, Chief Executive Officer, Experiences: Demand is healthy. We're expecting attendance at our domestic parks in Q3 compared to the prior year period to show improvement compared to the 1% decline reported in Q2, as headwinds related to international visitation stabilize and we begin to lap the opening of Epic Universe.
p. 6 · Read in context →
Warner Bros. Discovery (WBD)
HBO Max competes directly with Comcast's Peacock for streaming subscribers, and Warner Bros. rivals Universal Pictures at the box office. WBD's scaled, now-profitable streaming business is the benchmark against which Peacock's smaller, loss-making service is measured.
Warner Bros. Discovery says HBO Max has passed 140 million subscribers and guides to more than 150 million globally by year-end — the streaming scale it is building against subscale general-entertainment rivals, a group that includes Comcast's Peacock.
David Zaslav, President and Chief Executive Officer: Thanks to these successful launches, we've now meaningfully exceeded our guidance of over 140 million total subscribers by the end of Q1. We have strong and accelerating momentum and expect to finish the year with more than 150 million subscribers globally.
p. 2 · Read in context →
Warner Bros. Discovery frames its direct-to-consumer swing from a $2 billion loss to a $1.4 billion profit as proof it has cracked streaming economics at scale — the profitability milestone Comcast is still pursuing at Peacock.
JB Perrette, CEO and President, Global Streaming and Games: We were losing $2 billion and last year we were profitable by $1.4 billion. You saw the results today, growing increasingly double-digit on the bottom line.
p. 4 · Read in context →
More peer documents
CHTR_annual_report_FY2025 — 124 pages · Discloses Charter's 50/50 Xumo streaming-platform joint venture with Comcast — the clearest example of the two cable operators partnering rather than competing on the video/streaming layer. · Open →
Q3_FY2025 — 11 pages · Breaks out Fios versus fixed-wireless net adds and sizes FWA at ~5.4 million subscribers on $3 billion-plus annualized revenue — the fixed-wireless product competing with Xfinity home internet. · Open →
Q4_FY2025 — 10 pages · Iger quantifies Disney's DTC turn to $1.3 billion operating income from a $4 billion loss three years earlier — the streaming-profitability bar Comcast's Peacock is still working toward. · Open →
Q2_FY2025 — 9 pages · Zaslav discusses Harry Potter's success at Universal's parks and WBD's own theme-park ambitions with DC franchises — a rare naming of a Comcast asset and the IP-licensing overlap around Universal. · Open →
Fit
Does not fit the framework (P1 not met); contested: P4b
Does not fit the framework. Comcast clears the universe screens and trips no hard exclusion, and the dislocation-and-yield pillars are strong — a real 51% drawdown, an adjusted FCF yield above the 10% bar, a repurchase history that halved-then-cut the share count. But the year-10 durability gate (P1) does not hold at very-high conviction: the profit core, residential broadband, is losing subscribers to fiber and 5G fixed wireless, and that gate alone decides the answer. Confidence is medium — one non-load-bearing criterion (P4b) is contested and no probability spread exceeded 0.25. No exclusion hit; no watchlist_only flag; no prior-driven-risk flag.
The year-10 gate is binary by the framework's own construction: any proper doubt resolves to not met. Here the doubt is not stylistic — Comcast's own 10-K names the attackers and its own subscriber table quantifies the loss.
Universe and exclusions — unsoftened
Comcast passes both universe screens and trips no disqualifying exclusion. Stated plainly, so nothing hides behind the pillar arithmetic.
Universe — clears both. Class A common stock trades on the Nasdaq Global Select Market (CMCSA) — a US primary listing, not an ADR and not a Chinese issuer (U1, met). Market capitalization is roughly $82.7B — 3,709M diluted shares at the 2026-07-24 close of $22.30 [1] — about 8x the framework's $10B floor, even though that cap already reflects the halving from the 2024 peak (U2, met).
Exclusions — no hit. Comcast is a broadband, media and theme-park operator, not an automobile OEM (X1, not met). The promotional-CEO screen fails to fire: a 60-year-old business under founder-family control with a clean promise-versus-delivery record on capital return and Peacock profitability, against one slipping operating guide (X2, not met). The consensus-saturated-darling screen fails in the other direction — the stock is down 51% and trades near 1.4x EV/sales and 4.6x EV/EBITDA, the market pricing decline, not disruption (X4, not met). China dependence is immaterial: a single 30%-owned park (Universal Beijing) with non-recourse debt, inside a theme-parks segment that is 8% of revenue [2] (S1, not met — no sensitivity flag).
One dissent is worth recording without softening the result: on the structural-decline screen (X3), three jury seats read not met while one codex seat read met — residential video is in outright run-off (down 38% in customers over four years), but consolidated revenue has not fallen for three consecutive years, so the disqualifier does not fire. The verdict resolves not met; the dissent is the same broadband-and-video doubt that carries the gate below.
Pattern match
Comcast is closest to the framework's fourth setup — a quality monopoly/duopoly on a fear dip — but the match is partial. The dip is real (51% off the November-2024 peak, on a named, dated fear: broadband subscriber losses to fixed wireless and fiber), which is the pattern's entry signature. What the pattern also requires is that the fear be specific and testable and ultimately wrong — TikTok did not kill Instagram; one China quarter did not break Apple. Here the tested fear is not clearly wrong: the substitution is showing up in Comcast's own subscriber table, not just in a bear narrative. The setup therefore has the pattern's shape but not its resolution, which is exactly what the durability gate turns on.
It fits none of the other three patterns cleanly — it is not a large-bank cyclical at the bottom, not primarily a dividend-yield-carry name (the 5.9% dividend is a support, not the thesis), and not a healthcare/insurance one-year forecasting error that reprices back.
The pillar ledger
Source: deterministic tally (ruchir/fit_tally.json); reference lines from the framework spec. Verdicts are the framework's own, not scores.
Year-10 durability (gate) — P1, not met
This is the decisive point. The free-cash-flow leg of the gate is defensible — reported FCF was positive every year from FY2016 to FY2025, range-bound near $10.6B–$21.9B. The revenue leg is not high-conviction, and the gate requires both at very-high conviction. Domestic broadband customers fell 711,000 net in FY2025 to 31,255k, with penetration down to 47.6% from 49.8% [3], and the losses are accelerating (−66k in FY2023, −411k in FY2024, −711k in FY2025). Comcast's own 10-K names fiber overbuilders and 5G fixed-wireless carriers as direct broadband competitors [4], and T-Mobile has told investors it targets 18–19 million broadband subscribers by 2030. Four jury seats agreed on not met; the year-10 probability came in at 0.445 with a spread of just 0.04.
The strongest surviving counter-fact sits in the same breath: consolidated revenue held essentially flat ($121.4B in FY2022 to $123.7B in FY2025), and domestic broadband revenue actually rose despite the subscriber losses, because ARPU and fast-growing wireless offset volume. That is why the FCF leg holds — but pricing is a finite offset against a shrinking base, and that is the doubt the gate refuses to wave through. Full treatment: Durability.
FCF consistency — P2, met
Reported free cash flow has been positive and predictable for a decade with no negative or cyclical episode. The read is met, though one codex seat returned cannot_determine (cross-family agreement is therefore incomplete). The counter-fact is a data limitation stated plainly: the framework's preferred adjusted-FCF stability series is not_computable because stock-based compensation is missing from the structured feed for all ten years, so the consistency read rests on reported FCF rather than the SBC-and-acquisition-adjusted figure the framework specifies. See Yield and Durability.
Dislocation and yield — P3a, P3b, P3c, P3d, all met
The entry trigger is the framework's strongest region for Comcast. The drawdown is real and dated (P3a): 51.4% from a $45.14 peak on 2024-11-06 to a $21.92 trough on 2026-07-23, in legs anchored to broadband subscriber prints. Volume capitulation is present but modest (P3b): a 2.46x spike against the pre-peak median, clearing the ≥2x reference line but far below the double-digit multiples of true panic. The adjusted FCF yield clears the 10% moderate-balance-sheet bar on every basis (P3c): 24.2% current on FY2025 adjusted FCF of ~$20.0B, 19.4% on the three-year average. And consensus forward FCF clears the bar on every forecast year, so no mean-reversion underwrite is required (P3d, probability 0.88, spread 0.05).
The counter-facts travel with the numbers. The 51.4% depth stops short of the 60–70% forced-selling band the framework prizes, and roughly half the fall was a slow drift, not one capitulation. FY2025's headline yield is flattered by a low cash-tax year — income-tax payments were $755M versus $7,096M the year before [5] — so the run-rate normalizes nearer 15–17%. Still above the bar, but the current print overstates it. Full treatment: Dislocation, Yield, Damage Math.
Balance sheet and self-help — P4a met, P4b contested, P4c met
Comcast can comfortably outlast a multi-year problem without capital allocation being forced toward debt paydown (P4a): total debt of $98.9B [6] is 2.4x net-debt/EBITDA — moderate, inside the framework's sub-3.0x line — with near-$5B annual maturities against ~$21B of FCF and ~$21B of liquidity. The dividend is well covered (P4c): 5.9% yield at a ~22% payout, on a 17-year growth record, though the 2026 per-share cash rate was held flat for the first time in that streak.
The repurchase engine is the one contested criterion (P4b). The executed record is strong — roughly $62.7B of buybacks over 2016–2025 cut the share count 24% (4,875M to 3,709M), net of dilution, the opposite of a rising-share-count hard fail. But the buybacks were paused as of July 1, 2026 and are expected to stay paused through the ~one-year corporate separation [7], with $8.9B of authorization left unused [8]. Two claude seats read the executed habit as met; two codex seats read the live pause as not met — a 2–2 split resolving to contested. The flywheel is idle at exactly the moment a mid-teens yield would make it most valuable. Full treatment: Self-Help.
Diagnosis — P5, not met
The adversarial trial put the probability that the impairment is temporary at 0.38 (panel mean 0.44, spread 0.19, not contested), below the 0.65 line a fit would need and leaning toward a durable reset. A conservative permanent-reset FCFE perpetuity destroys ~$47B of value against ~$94B of price destroyed, so a real price-vs-value gap exists — but it survives at scale only in the temporary branch, which the trial rates the minority case. Note the nuance: at 0.38 with spread 0.19, P5 sits just above the framework's separate strongly-permanent cutoff (≤0.35 with spread ≤0.20), so P5 does not itself force the verdict — the P1 gate does.
In the same treatment, the temporary case has genuine, cited support: broadband losses narrowed 34,000 year-over-year in Q2 2026, the CFO dates the self-imposed repricing to lap in 2026, wireless hit a record quarter, and Peacock turned its first profit; reading the permanent brief first moved judges ~0.10 higher on temporary. Full treatment: Damage Math.
Instrument context — I1, not verifiable
Long-dated listed options on CMCSA extend to the January 2028 expiration (~18 months out) with ~31% 30-day implied volatility as of 2026-07-24 — inside the framework's up-to-50–55 reference band. The tally records I1 as not_verifiable, not "exists," because those facts come only from dated web sources (AlphaQuery, options-chain listings) with no in-corpus, PDF-citable filing to confirm them. Because the overall verdict is does_not_fit, the instrument line drives no watchlist_only overlay in any case. Facts only; see Clock.
What a 3x-in-3-years would require
The framework's target test is rendered from the tally's re-rating arithmetic — and here that arithmetic is unavailable: the tally records re_rating_math as null, because the applicable bar or normalized adjusted FCF needed to price the re-rating was not carried into the deterministic block. No target price is asserted where the inputs were not computed.
What can be stated is the base-rate context from this name's own history, framing only. An ~18-month full re-rating out of a 50%-plus drawdown has no precedent in Comcast's record: the only comparably deep episode (1999–2009, −68%) took roughly 12.7 years to reclaim its high, while the two moderate drawdowns that round-tripped in 10–15 months (2018 −29%, 2020 −32%) were half as deep as today's decline. Measured from the confirmed 2009 low the percentage recovery was fast — a double in ~1.8 years — but confirming the low is the precondition, and that is the durability question the gate leaves open. See Clock.
Contested and undetermined
Contested — P4b (repurchase engine). Both readings, with the split. The met reading: ~$62.7B of executed buybacks over 2016–2025 and a 24% share-count reduction, with the trend not rising — the framework's flywheel demonstrably real. The not-met reading: repurchases paused as of July 1, 2026 through the ~one-year separation, so the engine is switched off now, with $8.9B of authorization unused. Jury split 2–2 (claude a/b met; codex c/d not met); the name-masked seat resolved not met. The tally carries it as contested and, being non-load-bearing, it does not alter the gated verdict.
Undetermined. Nothing was marked cannot-determine. I1 returned not_verifiable (the options/IV facts exist only in web sources); it is recorded above and blocks no pillar verdict.
Provenance
Source: deterministic tally provenance block (ruchir/fit_tally.json) and trial tally (ruchir/trial/tally.json).
The verdict was pressed by two independent model families that agreed on the decisive gate and on the overall answer, disagreeing only on one non-load-bearing criterion (the buyback pause) — which is why confidence is medium rather than high. Re-running the trial with the briefs read in the opposite order moved the temporary probability only 0.10, and masking the company's name changed no gate criterion, so the answer is not an artifact of reading order or of the analyst's prior about the name.
The falsifier ledger
These are the standing what-would-change-this conditions carried from the tally — each a fact that, if it prints, cuts against the durability doubt (or, in the last several, would confirm it):
- adjusted FCF or EBITDA declines where flat-or-better was underwritten
- revenue declines for a third consecutive year
- capital allocation pivots to debt paydown over repurchases
- share count inflects upward
- the industry repricing cycle fails to materialize where industry-wide mean reversion was underwritten
- Aggregate convergence revenue (broadband+wireless) returns to YoY growth as free lines convert to paid — proving the offset actually offsets
- Domestic broadband net adds turn positive without further ARPU decline across multiple quarters post-lap
- Forward consensus FCF revised materially back up from ~$13.6B toward the $21.9B trailing level (the current cut is treated as durable, not one-year)
- Connectivity & Platforms adjusted EBITDA grows YoY in H2 2026 after investments lap
- Domestic broadband net additions turn positive or near-flat for four quarters after the 2026 investment lap without further ARPU decline.
- Connectivity & Platforms EBITDA returns to sustained YoY growth and residential margins recover toward the FY2025 run rate.
- Free wireless cohorts convert to paid relationships at scale so convergence revenue and ARPA grow without continued broadband price dilution.
- Peacock and the post-separation media portfolio offset linear subscriber-fee decline without relying on temporary event spikes.
- Broadband net losses re-accelerate past ~200k/quarter after the 2026 lap (Q4 FY2026-Q2 FY2027), showing the repricing bought no durable volume stabilization.
- Annual Connectivity & Platforms adjusted EBITDA breaks below its stable ~$30B band in FY2026/FY2027 rather than reverting once transition spend laps.
- FCF (excluding Versant removal and one-time transition investment) falls sustainably below the ~$20B run-rate, confirming the projected drop to ~$13.5B is structural not portfolio/timing.
- Broadband ARPU keeps declining after the base is fully on new plans by end-2026, with convergence/wireless failing to turn residential revenue positive — a permanent revenue-ceiling reset.
Data gaps
What the run could not answer, from the tally's list:
- Adjusted FCF and adjusted-FCF yield are
not_computableinfit_featuresbecause stock-based compensation is missing from the structured cash-flow feed for every year FY2016–FY2025; adjusted FCF (~$20.0B FY2025) and float-retirement (~4.1 yrs) were rebuilt from the filed 10-K (SBC $1,288M; 5-year-average acquisitions $562M), andfcf_stabilitycould not be computed at all. balance_sheet_classreturns unknown (the feed lacks a debt line); leverage (~2.4x net-debt/EBITDA, moderate) was computed from the 10-K debt footnote rather than the feature file.- Live consensus tone / analyst-rating distribution could not be pulled (provider errors), so the darling screen is settled from corpus pricing and CapIQ-derived features rather than current sell-side sentiment.
- Official reported short interest, holder-base/13F flow, and forced-seller disclosures were unavailable, so the split between anchored/forced sellers and informed sellers is unresolved.
- Implied-volatility facts (level, rank, LEAP expiries, liquidity) are from web research, not PDF-citable filings — the reason I1 is recorded as not_verifiable.
- The precise asset perimeter of the announced NBCUniversal/Sky separation is described only qualitatively on the Q2 FY2026 call; no registration document is in the corpus, so post-separation leverage, dividend policy and buyback-resumption date cannot be quantified.
- Consensus does not isolate how much of the FY2025→FY2026 FCF step-down is one-time cash-tax/Versant removal versus the broadband operating hit, so the clean operating numerator is bounded, not point-estimated.
- The
capitulation_gaugeanchors "peak" to the 2024-11-06 local high ($45.14), not the 2021 all-time high ($61.75); the deeper −64.5% drawdown from the true peak is computed directly from the daily price record.
Business
Comcast is a $82.7B US company on Nasdaq (CMCSA) — it clears the universe screen on both listing and size. Two-thirds of revenue and roughly 90% of segment profit come from a capital-heavy, locally concentrated, FCC-regulated broadband network; the rest is NBCUniversal media and Universal theme parks. It is not a consensus darling: the stock is down 51% from its 2024 peak and trades near 1.4x sales. Not an auto-OEM; China exposure is one 30%-owned park.
Universe screen (U1, U2)
Comcast's Class A common stock trades on the Nasdaq Global Select Market under CMCSA — a US primary listing, not an ADR and not a Chinese issuer [1]. Market capitalization is $82.7B (3,709M diluted shares at the $22.30 close on 24 July 2026), roughly eight times the framework's $10B floor. Both universe tests pass cleanly.
Market Cap
Universe Floor
Source: market cap derived from reported diluted shares (FY2025 10-K, Consolidated Statement of Operations [2]) and the 24 July 2026 close; per fit_features.market_cap_usd.
What the company sells
Comcast describes itself as "a global media and technology company" running two primary businesses [3]:
Connectivity and Platforms — residential and business broadband, wireless, video and voice under the Xfinity, Comcast Business, Sky and NOW brands. This is the cable-network business: it owns the physical last-mile plant, passes roughly 65 million domestic homes and businesses, and sells internet as the anchor of a bundle. Its wireless service, Xfinity Mobile, is not a network — Comcast resells capacity as a mobile virtual network operator over Verizon's network (adding T-Mobile for business lines in 2026) [4].
Content and Experiences — NBCUniversal's media networks (NBC, Telemundo, Peacock), film and television studios (Universal), and Universal theme parks in Orlando, Hollywood, Osaka, Beijing and — from 2025 — the new Epic Universe park [5].
On 2 January 2026 Comcast completed a tax-free spin-off of Versant — a package of cable networks including CNBC, USA Network and E! — to shareholders as a separately listed company (VSNT). The FY2025 results below still consolidate Versant, so the reported media segment overstates the go-forward business [6].
Where the money is
The two segments are not equals. Connectivity and Platforms produced $81.1B of FY2025 revenue at a ~40% adjusted-EBITDA margin; Content and Experiences produced $38.1B at a ~9% margin. Broadband-led connectivity is the profit engine — about 90% of segment EBITDA — while media and parks are lower-margin and, in Content and Experiences' case, capital-hungry (Epic Universe).
Source: FY2025 segment results, as reported (company filings); segment adjusted EBITDA per the FY2025 10-K MD and A [7].
Consolidated FY2025 revenue was $123.7B, essentially flat on FY2024's $123.7B, with $20.7B of operating income, $37.4B of adjusted EBITDA and $5.39 diluted EPS [8]. Total debt was $98.9B against $9.5B of cash [9] — net debt near $89B, roughly 2.4x adjusted EBITDA; the balance sheet feature is not_computable from the structured feed, and the maturity profile and its implications are carried by Self-Help.
Geography of revenue
Revenue is overwhelmingly domestic. The United States supplied $95.1B of FY2025 revenue (77%), the United Kingdom (chiefly Sky) $15.2B (12%), and all other markets combined $13.4B (11%) [10].
Source: FY2025 Annual Report (Form 10-K), geographic revenue note [11].
Scale and the operating base
The connectivity business runs on customer counts, and the direction of travel matters for the durability question. Domestic broadband customers stood at 31.3 million at year-end 2025 but fell by 711,000 net over the year; domestic video continued its secular decline (−1.25 million to 11.3 million); wireless lines grew 1.48 million to 9.3 million; Peacock reached 44 million paid subscribers. Comcast employs roughly 179,000 people (full-time-equivalent), about 30% outside the United States [12].
Domestic Broadband (M)
Wireless Lines (M)
Video Customers (M)
Peacock Subs (M)
Source: FY2025 customer metrics, as reported (company filings); MD and A customer metrics [13].
The share count tells the ownership story: Comcast has retired stock steadily, from 4,875 million shares in 2016 to 3,709 million in 2025 — a 24% reduction — funded by consistent buybacks. That capital-allocation record is the substance of the framework's self-help pillar and is developed in Self-Help.
Market structure — the durability raw material
This is the evidence Durability and the jury will lean on, so it is laid out plainly, both sides.
The structural case for concentration. US residential broadband has historically been a two-provider market in any given neighborhood: the cable incumbent (Comcast) and the telephone company. Building a competing last-mile network is capital-intensive and slow, the product is essential, and the business is regulated at federal, state and local levels — the Communications Act of 1934 and the FCC set the terms, and local franchises govern the plant [14]. Comcast has operated this network for decades. These are the traits the framework prizes: capital-heavy essential infrastructure with regulatory friction against new entry.
The competitive case against it. The concentration is eroding, and Comcast's own 10-K names how. Broadband now competes on three fronts at once [15]:
Wireline telcos — AT&T, Lumen and Verizon in the US, BT and Virgin Media O2 in the UK — are extending fiber deeper into Comcast's service areas at speeds copper DSL cannot match.
Wireless carriers — AT&T, T-Mobile and Verizon — sell 5G fixed-wireless home internet as a cheaper substitute, and are pulling price-sensitive subscribers from cable [16].
Municipal and satellite broadband, plus federally subsidized deployment funding, add further capacity inside the footprint.
The result is visible in the numbers above: broadband customers are falling, not growing. Video faces the full weight of streaming cord-cutting, and NBCUniversal's networks and studios compete head-to-head with Disney, Warner Bros. Discovery, Netflix and the streaming platforms. So the honest read is two-sided: the assets are genuinely hard to replicate and the product is essential, but the market is no longer the protected local duopoly it once was, and unit volumes are declining. Whether that decline is cyclical pricing/promotional pressure or a structural loss of position is the question Durability adjudicates; this tab establishes that the question is live, with subscribers already shrinking.
The named peer set is genuine: Charter (the #2 US cable operator, the closest direct rival), Verizon, AT&T and T-Mobile in connectivity, and Disney and Warner Bros. Discovery in media — all confirmed competitors from Comcast's own filing.
First-pass exclusion screen
Auto-OEM (X1) — clear. Comcast is a broadband, media and theme-park operator with no automotive manufacturing. The exclusion does not apply.
Consensus-saturated darling (X4) — clear, and then some. This is the opposite of a story stock. CMCSA is down 51% from its 6 November 2024 peak of $45.14 to $22.30, and trades at roughly 1.4x enterprise-value-to-sales and 4.6x EV/EBITDA (EV ≈ $172B on $89B net debt). Consensus forward free-cash-flow yield on the current market cap runs in the mid-teens — about 16.5% on FY2026 and 16.1% on FY2027 estimates. A high-growth darling on an extreme multiple-to-sales looks nothing like this; the market is pricing decline, not disruption. There is no darling flag here.
Source: EV multiples derived from reported FY2025 revenue, adjusted EBITDA and net debt (10-K [17], [18]) and the current market cap; consensus forward FCF yield per fit_features.consensus_forward_yield.
China dependence (S1) — a minor flag, quantified. Comcast's China exposure is a single asset: Universal Beijing Resort, a theme park it owns 30% of through a consortium with Chinese state-owned partners, consolidated as a variable-interest entity with $3.6B of non-recourse, RMB-denominated debt secured only by the park's own assets [19]. China revenue is not separately disclosed but sits inside the $9.8B theme-parks segment (8% of total revenue), of which Beijing is one of several parks — a low-single-digit share of the company at most. With 77% of revenue in the US and 12% in the UK, Comcast carries no material China revenue or balance-sheet dependence; the flag is present but immaterial.
The promotional-CEO (X2) and structural-decline (X3) checks belong to Self-Help and Durability; nothing in the business overview forces either, though the declining broadband and video unit counts documented above are the raw material Durability will weigh against the structural-decline test. Revenue itself has not met the framework's disqualifier — three consecutive years of high-single-digit decline — with FY2025 revenue essentially flat and only one year of marginal decline on record.
Dislocation
Comcast has lost roughly half its market value — $45.14 on 6 November 2024 to a $21.92 trough on 23 July 2026, down 51.4% over 624 days. The fall came in identifiable legs on dated earnings events, but the trigger was never an EPS miss: the company beat consensus every quarter through the decline. What repriced was the broadband franchise — subscriber losses, then the ARPU and EBITDA cost of defending them. The volume gauge is present but modest at 2.5x.
The drawdown, quantified
Peak — 6 Nov 2024
Trough — 23 Jul 2026
Current — 24 Jul 2026
Peak-to-Trough
Source: derived from daily price history; drawdown figures per fit_features.capitulation_gauge.drawdown (peak $45.14, trough $21.92, −51.4%, 624 days).
The peak-to-trough decline is 51.4% — deep, but short of the 60–70% forced-selling zone the framework hunts. It unfolded not as a single crash but as a staircase: two sharp legs on the FY2024 broadband print, a long plateau through 2025, then a second descent through 2026 to the July trough.
Source: derived from daily price history, month-end closes.
The legs, dated to their trigger events:
Source: derived from daily price history; event dates matched to Comcast earnings releases and transcripts.
Between Leg 2 (Jan 2025) and Leg 3 (Apr 2026) the stock spent fourteen months in a $31–37 band, absorbing a market-wide 6.6% fall on 4 April 2025 (the tariff selloff, not a Comcast event) but making no new low. The dislocation is two clustered event legs bracketing a long drift, not one continuous capitulation.
The trigger
The identifiable adverse event is the broadband subscriber print, and it arrived twice. At an early-December 2024 investor conference management flagged a soft fourth quarter; the stock fell 9.5% on 9 December 2024. The confirmation came on 30 January 2025, when Comcast reported net broadband subscriber additions of negative 139,000 for Q4 2024 — "disappointing and worse than what we indicated in early December" — with management adding they "see no signs of this changing in the near term" [1]. The stock fell 11.0% that day. Critically, the same call reported record 2024 revenue and $12.5 billion of free cash flow [2] — the repricing was about units and the competitive path, not the current-year cash number.
The competitive mechanism is named in the filings: 5G fixed-wireless networks from the mobile carriers and rapid fiber overbuild, compounded in 2024 by the end of the federal Affordable Connectivity Program subsidy [3] [4]. Over the full year 2025, total domestic broadband customers fell 711,000 to 31.3 million — a wider loss than 2024's 411,000 — and broadband penetration of homes passed slipped to 47.6% from 49.8% [5].
The 2026 legs carry a different, telling character. On 24 April 2026 the stock fell 12.9% — the single worst day of the whole decline — on a quarter where the news on units was good: broadband losses improved by 117,000 year-over-year to 65,000, the first year-over-year improvement since Q4 2020, and wireless posted record net additions. What sold the stock was the cost of that improvement. Adjusted EBITDA declined 9%, and broadband ARPU fell 3.1%, as simplified pricing and a bundled free-wireless-line offer diluted revenue per customer [6]. The final leg to the trough came on 23 July 2026, when Q2 broadband losses of 167,000 — themselves a 34,000 year-over-year improvement — were not enough to stem the slide [7].
The trigger, then, evolved. In 2024–25 it was the volume of subscriber losses; by 2026 it was the margin price of defending the base. Both are the same underlying fear — that fixed wireless and fiber have structurally changed the broadband franchise — expressed through different line items.
The fear gauge
The measured capitulation is present but not violent. fit_features records a volume spike of 2.46x, defined as the peak 20-day average volume during the fall divided by the median daily volume over the 180 days before the peak (about 17.3 million shares).
Source: derived from daily volume history; median pre-peak volume ≈17.3M shares (180 sessions before 6 Nov 2024).
Two features matter. First, where the sustained-volume peak sat: the heaviest 20-day window ended around 1 July 2026 — late in the fall, near the trough, not at the January 2025 trigger. To the extent there was emotional selling, it clustered at the bottom rather than at the first bad news, which is the pattern the framework looks for. Second, the single largest raw-volume days of the decline — 246 million shares on 20 March 2026 and 134 million on 29 June 2026 — fall on index-rebalance and quarterly-expiry dates, so they read as mechanical passive flow rather than fear. The genuine event-driven spikes (3–4.5x the pre-peak median on the earnings days) are real but sit well below the double-digit multiples that mark true capitulation. This is orderly, event-anchored repricing with a fear component, not a panic.
Who was selling
The direct evidence here is thin, and the honest statement is that seller composition cannot be pinned down. Official reported short-interest data for CMCSA is unavailable in this run — FINRA returned no position rows, so short level, change, and days-to-cover are all blank. No forced-seller disclosures (fund liquidations, threshold net-short filings) are staged. Comcast remains an S&P 500 and Nasdaq-100 constituent, so there was no index-exit forced-sale event.
What can be said comes from the trading record. Liquidity is deep — roughly $900 million of stock changes hands daily and annual turnover runs about 164% of the float — so no holder was trapped by an inability to exit. The concentration of the largest-volume sessions on rebalance and expiry dates points to passive and index-linked flow reweighting a shrinking market cap, alongside the informed event-day selling on the earnings prints. Absent short-interest and holder-flow data, the balance between anchored/forced sellers and informed sellers is a genuine gap rather than a finding.
Estimates versus price
Consensus earnings did fall, but the price fell roughly twice as far. Over the past six months, consensus FY2027 EPS was cut from $4.10 to $3.64 (−11%) and FY2028 from $4.53 to $3.96 (−13%), while forward revenue eased only about 2%. Over the same window the stock fell about 24%.
Source: FY2027 consensus EPS revision path (CapIQ, data/sp/estimates.json) vs CMCSA close on each revision date; derived, indexed to 100 at 26 Jan 2026.
The two lines tracked each other into April 2026, then diverged: from April to July the price dropped a further 18% while the EPS estimate barely moved. The wider frame is starker. Across the full 51% market-cap decline, consensus forward free cash flow held in a $13–17 billion band and forward revenue stayed near $120 billion; against the current market cap that forward FCF computes to a 16–19% yield before any framework adjustment (fit_features.consensus_forward_yield). A price cut roughly double the estimate cut is the framework's dislocation signature.
Bottom line
There is a real dislocation here: a 51% market-cap decline against forward free cash flow and revenue that barely moved, on dated, cited triggers, with the price outrunning the estimate cut by roughly two to one. But it does not present as the clean Centene-style single-event anchor. Comcast beat EPS every quarter of the fall; the reprice came in two clustered legs a year apart and reflects a persistent, structural fear about the broadband franchise — fixed-wireless and fiber competition — expressed first through subscriber counts and then through the ARPU and EBITDA cost of defending them. The capitulation gauge is modest (2.5x) and the depth stops short of the 60–70% forced-selling zone. Whether the damage to units and margins is temporary or structural is not settled here — that question belongs to Damage Math and the trial. This tab records what happened: a deep, event-anchored, but orderly and structurally-themed repricing.
Damage Math
Comcast's equity fell 53% — about $93.7B — from its November 2024 peak, while consensus forward free cash flow fell roughly 20% ($16.9B to $13.6B) and FY2026 EPS fell 18.5%. About a third of the drawdown is the cash-flow cut; two-thirds is the market re-rating Comcast from a 9.6% to a 16.5% free-cash-flow yield. That re-rating is warranted only if the decline is durable — the profile's trial puts the probability it is temporary at 0.38.
The near-term hit — the numerator
The trigger is not a single-day guidance cut. Comcast peaked at $45.14 on 6 November 2024 and ground lower over 624 days as a self-imposed broadband repricing collided with fiber, fixed-wireless and satellite competition. FY2025 itself was a strong year on the face of it — revenue $123.7B, diluted GAAP EPS $5.39, adjusted EBITDA $37.4B [1] — but the damage lives in the forward numbers, where consensus marked down the earning power the market capitalizes.
Consensus FY2026 EPS
▼ -18.5% vs FY2025 $4.31
Consensus FY2026 FCF ($B)
▼ -19.6% vs FY2025 $16.9B
Market Cap ($B)
▼ -53.1% from peak
Consensus FY2027 EPS
▼ -11.2% revised down 180d
Source: FY2025 reported figures, FY2025 Annual Report (Form 10-K) [2]; forward consensus per CapIQ estimate feed (data/sp/estimates.json, vintage 2026-07-25), derived from fit_features.consensus_forward_yield.
Two lines carry the cut. Normalized EPS troughs at $3.51 in FY2026, down 18.5% from the $4.31 FY2025 actual, then edges back to $3.64 in FY2027 and $3.96 in FY2028 — a shallow V, not a slide, on the current sheet. The forward curve itself was marked down over the last six months: FY2027 EPS fell from $4.10 to $3.64 (−11.2%) and FY2028 from $4.53 to $3.96 (−12.7%); FY2027 revenue slipped 2.0% and FY2028 revenue 3.9%.
Source: CapIQ estimate momentum, 180-day vs current (data/sp/estimates.json, momentum), vintage 2026-07-25 — no backing PDF page.
Free cash flow is the murkier line, and honesty requires flagging why. Management reported FY2025 free cash flow of $19.2B, "the highest year on record," but said plainly it was inflated by roughly $2B of one-time cash-tax benefit that will not recur, favorable working capital, and lower capex — and that the Versant spin-off "removes a significant pool of cash flow" going forward [3]. The vendor feed carries FY2025 FCF at $21.9B and consensus at $16.9B; forward consensus sits at $13.6B (FY2026) and $13.3B (FY2027). So part of the ~$3.3B step down from the $16.9B normalized base is portfolio and timing — one-time tax and the Versant pool — not broadband earning power. The clean numerator is therefore the EPS cut (−18.5%) and the ~20% forward-FCF reset, with the caveat that not all of the FCF drop is the operating problem.
Source: CapIQ consensus FCF (data/sp/estimates.json), via fit_features.consensus_forward_yield; FY2025 shown at the $16.9B consensus/normalized level, not the $21.9B one-time-boosted reported figure.
The price and enterprise-value move, side by side
Consensus FY2026 EPS fell 18.5% and forward FCF about 20%; the market cap fell 53%. That asymmetry is the whole tab. On 3,908M shares at the $45.14 peak, Comcast was worth about $176.4B; at $22.295 on 3,709M shares it is worth $82.7B — a $93.7B loss of equity value, roughly three times the proportional cut to the cash-flow line.
Enterprise value fell less. With about $90B of net debt sitting ahead of the equity — total debt was $90.4B at 30 June 2026 against $98.9B at year-end 2025, and management put net leverage at 2.3× [4] [5] — enterprise value fell from roughly $268B to roughly $165B, about −38%. The debt is a fixed claim, so a 38% fall in the whole firm's value became a 53% fall in the equity beneath it. Leverage amplifies both the damage and, if the cash flows hold, the recovery.
The decomposition matters more than either number alone. At the peak the market capitalized normalized FCF (~$16.9B) at about 10.4× (a 9.6% yield). Today it capitalizes forward FCF (~$13.6B) at about 6.1× (a 16.5% yield). Split the $93.7B drawdown:
Source: derived — peak $176.4B (3,908M shares × $45.14, 2024-11-06) and current $82.7B (fit_features.market_cap); multiple 10.4× normalized FCF at peak, 6.1× forward FCF now (data/sp/estimates.json).
Holding the peak 10.4× multiple and applying only the cash-flow cut takes the equity from $176.4B to about $141.4B — so roughly $35B (37%) of the drawdown is the earnings cut. The remaining $58.7B (63%) is pure re-rating: the market roughly doubled the free-cash-flow yield it demands, from 9.6% to 16.5%. The temporary-versus-permanent question is really a question about that 63%.
How much NPV the problem plausibly destroyed
The re-rating is justified — or not — by what happens to the FCF level after the transition laps. A transparent free-cash-flow-to-equity perpetuity makes the arithmetic visible. Assumptions, stated: base forward FCFE of $13.6B (the FY2026 consensus, already levered — Comcast's free cash flow is struck after cash interest); cost of equity of 9%; terminal growth the variable under test. Because FCFE is post-interest, it is discounted directly to equity value with no further net-debt subtraction.
Source: derived — FCFE perpetuity, base $13.6B × (1+g)/(r−g); base from CapIQ consensus (data/sp/estimates.json). Reproducible from the numbers shown.
The current $82.7B equity value sits below every cell in a plausible 8–12% discount / −3% to +2% growth grid. To reconcile the price mechanically requires either a discount rate near 16% at zero growth, or a permanent FCF decline of about −6% a year at 9% — i.e., the market is pricing Comcast as a melting annuity, not a stable essential. Whether that is right is exactly the diagnosis question.
Cast as the framework's two scenarios:
- Temporary. FCF is depressed by ~$3.3B a year for three years (FY2026–28) while the repricing laps, then reverts to the ~$16.9B normalized base. NPV destroyed = the present value of that three-year shortfall only: $3.3B × (0.917 + 0.842 + 0.772) ≈ $8B. Intrinsic value barely moves; the ~$94B price move is a ~12× overshoot.
- Permanent (conservative). FCF resets permanently ~$3.3B lower and grows 2%. NPV destroyed = $3.3B ÷ (0.09 − 0.02) ≈ $47B. Real, large — but still short of the $93.7B the price took out, because a level shift at a 9% discount does not, by itself, justify also doubling the yield.
- Permanent (as priced). The market has done both — cut the level and re-rated the yield to ~16.5% — which is internally consistent only if the FCF base keeps declining (g near −6%). On that reading the ~$94B price move is roughly fair and the gap closes.
Source: derived — perpetuity workings above (r = 9%, g = 2%); price damage $93.7B from fit_features.market_cap and the 2024-11-06 peak.
The gap between price damage and plausible NPV damage is real but conditional. It is large — roughly $85B — only in the temporary branch. In the conservative permanent branch it is about $47B, and it disappears entirely if broadband follows video into secular decline. Unlike Centene — where a one-year guidance cut took the stock down about two-thirds while the NPV plainly held — Comcast's drawdown is dominated by a yield re-rating that only pays if the cash-flow decline reverses.
The trial — temporary or permanent, at comparable depth
The diagnosis was argued by two opposing corpus-cited briefs and ruled on by three blind judges. Both cases are strong; the ruling, not this tab, carries the probability.
The case for temporary. The impairment is a chosen, time-boxed transition, not demand destruction. The CFO framed the pain as investment: "we expect incremental EBITDA pressure over the next couple of quarters until we begin to lap these initial investments in 2026," alongside a 4.5% Connectivity and Platforms EBITDA decline the size of a reinvestment, not a collapse [6]. The leading indicators have inflected: broadband net losses improved 34,000 year-over-year to 167,000 in Q2 FY2026 on the new go-to-market strategy [7], with management guiding to "modest improvements starting in the third quarter" [8]. The offsetting engine is scaling — a record 448,000 wireless net adds [9] against only 7% penetration of the footprint, a long runway [10] — cash generation never broke, with Q2 FY2026 FCF of $4.6B [11], and the media drag turned: Peacock posted its first-ever quarterly profit, $189M [12].
The case for permanent. The impairment is the breakdown of the cable compounder, which for years offset video attrition with broadband rate and buybacks. The new record shows the opposite: domestic broadband revenue fell "due to decreases in average rates and declines" in customers — price and volume together, not a chosen price cut alone [13]. The earnings core is shrinking: Connectivity and Platforms revenue fell 3.0% and adjusted EBITDA 5.7% in Q2 FY2026, with residential EBITDA down 8.0% and its margin down 160 basis points [14]. Broadband penetration of passings fell to 47.9% from 49.7%, video customers fell another 280,000 in the quarter, and the wireless offset is promotional — half of residential connects came from free lines [15]. Linear networks "continue to experience accelerated net customer losses" [16], consensus marked the forward EPS and revenue curves down, and the buyback bridge is weaker: Comcast suspended repurchases at the start of Q3 2026 [17].
The ruling. The judges put the probability the impairment is temporary at 0.38 (mean of the panel 0.44), with a spread of 0.19 across seats (0.37 / 0.38 / 0.56) and the ruling recorded as not contested. Reading order moved the panel about 0.10 — judges who read the permanent brief first landed higher on temporary — but not enough to flip the finding. On the panel's math the diagnosis leans toward a durable reset: roughly 62% weight on permanent, 38% on temporary. That ruling stands as the report's diagnosis; nothing in this tab's own arithmetic overrides it.
The buyback suspension deserves one clarifying line, because it cuts both ways: it was declared "in connection with the proposed NBCUniversal Spin-off," not forced by distress [18]. Whether that is a temporary, technical pause or the removal of the flywheel exactly when a 16.5% yield makes it most valuable is taken up in the Self-Help tab.
Which line broke — and whether it self-corrects
The break is in Residential Connectivity and Platforms, and specifically domestic broadband. Broadband ARPU fell 3.8% in Q2 FY2026 as Comcast withheld its usual rate increase and layered in free wireless lines [19], while the subscriber base fell 167,000 and penetration slipped to 47.9% [20]. Price and volume fell at once, so residential EBITDA fell 8.0% and its margin 160 basis points [21]. Video keeps draining underneath it — another 280,000 customers lost in the quarter [22].
The repricing mechanism that would self-correct is specific and dated: the reinvestment stops recurring once the base rolls onto simplified plans, which management dates to a lap "in 2026" [23]; free wireless lines convert to paying relationships after a year and convergence scales from a 7% penetration base [24]; losses are already narrowing rather than widening [25]. The structural case against is equally specific: broadband is losing customers to fiber, fixed wireless and satellite in an "increasingly competitive environment" that is not a chosen price cut, and video decline is accelerating [26] [27]. The evidence that would decide it is the same evidence the trial named: broadband net adds turning positive without further ARPU decline for several quarters after the 2026 lap, and forward FCF revised back up toward the ~$18–19B run-rate rather than holding at ~$13.5B. The repricing anatomy runs alongside the Dislocation drawdown analysis; the durability of the broadband franchise on the long clock is taken up in Durability.
Yield
On the framework's own basis — adjusted free cash flow (reported FCF less stock-based compensation less the 5-year average of acquisition spend) — Comcast generates roughly $20.0 billion in FY2025, a 24.2% yield on today's $82.7 billion market cap. Against the 10% reference line that a moderate balance sheet (net debt 2.4× EBITDA) selects, every measure clears: 19.4% on the three-year average, ~15–17% on normalized cash flow, and ~14% on consensus forward FCF after the same adjustments. FY2025's figure is inflated by a low cash-tax year; the normalized read still sits well above the line.
The adjustment, line by line
The deterministic feature file returns adjusted_fcf as not computable — the structured cash-flow feed dropped the share-based-compensation line for every year, so the derivation could not run (see the note below). The adjustment is rebuilt here directly from the filed 10-K cash-flow statements, where SBC and acquisitions are both disclosed.
Adjusted FCF = reported FCF − SBC − trailing 5-fiscal-year average acquisition spend; derived from company filings. Reported FCF and SBC per the FY2025 10-K cash-flow statement [1] and the FY2023 10-K for FY2021–FY2022 [2].
Reported free cash flow ran $21.9 billion in FY2025, up from a $15.5–16.3 billion band across FY2022–FY2024 [3]. The two deductions the framework requires are small relative to the base. Share-based compensation is modest for a company this size — $1,288 million in FY2025, essentially flat since FY2021 [4] — about 0.9% of dilution-adjusted market cap, not the compounding share-issuance problem that disqualifies serial diluters. Acquisitions have been light: $1,306 million in FY2025, $119 million in FY2024, zero in FY2023, $12 million in FY2022, and $1,374 million in FY2021, a five-year average of $562 million [5]. That window deliberately excludes the ~$39 billion Sky purchase (FY2018), which sits outside the trailing five years; the recent record is tuck-ins, so the adjustment removes roughly $1.85 billion a year and leaves adjusted FCF at $20.0 billion for FY2025.
The yield, three ways
Current Adjusted Yield (FY2025)
3-Year Average
Normalized (mid-cycle)
Adjusted FCF ÷ market cap of $82.7B (3,709M shares at $22.295, 24 Jul 2026; fit_features.market_cap.native). Adjusted FCF derived from FY2021–FY2025 10-K cash-flow statements [6].
The current-year yield of 24.2% ($20.0B ÷ $82.7B) is the headline, but FY2025 is the strongest cash-flow year in the series and should not be read as the run-rate. The three-year average adjusted FCF of $16.0 billion (FY2023–FY2025) yields 19.4% on the same market cap — a cleaner read that already dampens the FY2025 spike. The normalized figure, worked below, lands near 15–16%. The three converge on the same conclusion: at today's price the yield sits far above the 10% moderate-balance-sheet reference line, whichever basis is used.
Is this a jump from a stable baseline? The feature file's yield_baseline is also not computable (it needs fiscal-year-end prices the run did not carry), so the jump test is estimated from the drawdown rather than measured. The stock fell from $45.14 on 6 Nov 2024 to $22.30, a 51% decline (fit_features.capitulation_gauge). At the November-2024 peak, roughly $176 billion of market cap, the same normalized ~$13–14 billion of adjusted FCF yielded about 7.5–8%; at today's $82.7 billion it yields ~16%. The yield has roughly doubled on price alone, which meets the framework's ≥2× jump signature — though as an estimate, not a computed baseline. Comcast is not the classic fortress "stable 3.5–4% suddenly at 9%" name; it is a moderate-leverage cable and media operator that had already de-rated, and the fear leg roughly doubled an already-elevated yield.
Which bar applies
The reference line is selected by the balance sheet. The computation, from the FY2025 10-K:
Total debt of $98.9B (current $5,958M + noncurrent $92,979M) and cash of $9,481M per the FY2025 balance sheet [7] and Note 6 Debt [8]; consolidated Adjusted EBITDA of $37,384M per the 10-K reconciliation [9].
The feature file returns balance_sheet_class as unknown because the structured feed lacked a debt figure, so this too is rebuilt from the filing. Net debt of $89.5 billion against $37.4 billion of Adjusted EBITDA is 2.4× — inside the framework's moderate band (fortress at or below 0.5×; levered at or above 3.0×) [10]. The moderate class carries the 10% bar, judged on the three-year average and an underwritable forward. Comcast is neither a net-cash fortress (which would lower the line to 8–9%) nor a levered cable operator like Charter (which would raise it to 25%). At 19.4% on the three-year average against the 10% line, the yield runs roughly 940 basis points ahead of the bar; even the ~15–16% normalized figure sits ~500–600 basis points ahead.
Normalized mid-cycle yield
Comcast is not meaningfully cyclical in the way a bank or a commodity producer is — broadband, wireless and business connectivity are subscription revenue, and the media and parks segments add only modest sensitivity to advertising and attendance. The distortion in FY2025 is not economic; it is a cash-tax timing swing. Cash income taxes paid fell to $755 million in FY2025 from $7,096 million in FY2024 [11], roughly a $6 billion under-payment that inflates FY2025 operating cash flow and reverses as deferred taxes unwind.
Two independent normalizations bracket the run-rate. Anchoring to the FY2022–FY2024 reported FCF average of $15.8 billion, less $1.3 billion SBC and $0.6 billion acquisitions, gives normalized adjusted FCF of about $14.0 billion — a 16.9% yield. Anchoring instead to consensus forward FCF (FY2026–FY2029 average of $14.2 billion, below), less the same $1.85 billion of adjustments, gives about $12.3 billion — a 14.9% yield. The mid-cycle read is therefore ~$12.3–14.0 billion of adjusted FCF, a 15–17% yield, comfortably above the 10% line. A skeptic who instead treated FY2025's low-tax FCF as sustainable would arrive at 24%; one who assumed cash taxes snap all the way back to the FY2024 $7 billion level would still land near 13–14%. The conclusion holds across the window.
The consensus check
The relevant CapIQ series is consensus free cash flow (mean estimate), the closest direct proxy the vendor carries; fit_features.consensus_forward_yield sources it from the estimates feed dated 25 July 2026.
Consensus free cash flow (mean), per fit_features.consensus_forward_yield, sourced from CapIQ estimates (data/sp/estimates.json, 25 Jul 2026); yields computed on the current $82.7B market cap.
Consensus forward free cash flow — the sell side's own numbers, not the buy side's fear — runs $13.3–15.6 billion a year through FY2029, a 16.1–18.8% gross yield on today's market cap. Subtracting the same SBC and acquisition adjustments (~$1.85 billion) leaves adjusted forward FCF near $11.5–13.7 billion, a ~14–17% adjusted yield that still clears the 10% bar on every forecast year. The framework's reading of this configuration is explicit: when consensus forward FCF also clears the bar, the sell side already agrees on the cash flow and the discount is fear, not a disputed forecast. That is the case here — no mean-reversion underwrite is required, because consensus never dips below the line. The one caveat is direction: consensus FCF steps down from the FY2025 actual (~$16.9 billion) to ~$13.3 billion by FY2027 before recovering, consistent with cash taxes normalizing and video subscribers declining. The bar is cleared on the trough forecast, so the setup does not depend on a recovery that has to be argued.
FCF/revenue trend
FCF ÷ revenue; derived from FY2021–FY2025 reported financials — cash-flow statement [12] and income statement [13]; FY2021 revenue of $116,385M per the FY2023 10-K [14].
Free-cash-flow conversion has held in a 12.5–17.7% band of revenue across the five years, with no downward drift: 17.2% (FY2021), 13.0% (FY2022), 13.4% (FY2023), 12.5% (FY2024), 17.7% (FY2025) [15]. Conversion is stable, which supports rather than undercuts the yield case — the framework's concern is a deteriorating FCF/EBITDA or FCF/revenue trend that would signal the flat-to-up underwrite is failing, and that is not present here. The offsetting fact belongs alongside it: revenue itself is essentially flat, $116.4 billion in FY2021 to $123.7 billion in FY2025 (~1.5% a year) and down fractionally in FY2025 [16]. Stable conversion on flat revenue keeps cash flow steady but leaves no organic growth tailwind; whether the top line can hold is the durability question examined in Durability, and the pending Versant separation of the cable networks will reshape the reported entity. On yield alone, the cash is real, consistent, and priced at a double-digit discount to the framework's line.
Comcast's cash engine is durable; its top line is where the genuine doubt sits. Reported free cash flow has stayed positive and range-bound near $15–22 billion for a decade, and consolidated revenue is flat, so the framework's three-year high-single-digit revenue-decline disqualifier does not fire. But the profit core — residential broadband — is now shrinking in subscribers (a 711,000 net loss in FY2025), attacked simultaneously by fixed-wireless and fiber, with price the only offset. Year-10 free cash flow is defensible; year-10 revenue is not high-conviction.
The bottom line on the gate
The year-10 gate asks one thing plainly: is it very-high-conviction that both year-10 revenue and year-10 adjusted free cash flow will exceed today's? On the free-cash-flow leg the evidence is strong. On the revenue leg it is genuinely two-sided, and the doubt is structural rather than a matter of execution. The gate, read once and plainly below, does not hold at very-high conviction — because the revenue leg does not.
The deterministic feature file cannot compute adjusted free cash flow for Comcast: stock-based compensation is absent from the cash-flow feed for every fiscal year 2016–2025, so fit_features.adjusted_fcf.latest_adjusted is not_computable and, downstream, fcf_stability and the adjusted-FCF yield are unavailable. This tab therefore uses reported free cash flow (available and stable) as the durability proxy for the cash leg, and says so wherever it matters — the missing SBC and acquisition deductions would lower the level of adjusted FCF but do not change the stability signal the reported series shows.
The conviction sources, graded for Comcast
Market structure — a broadband duopoly per footprint, but a contested one. Comcast's network passes 64,983 thousand domestic homes and businesses [1], and in most of that footprint wireline broadband is a two-player game against a telco. That is the source of the pricing power visible below. But Comcast's own 10-K no longer describes a two-player market: it names wireline fiber builders (AT&T, Lumen, Verizon; BT and Virgin Media O2 in the UK) and wireless companies offering 5G fixed-wireless internet as direct competitors for the same broadband customer [2]. Share is not stable: domestic broadband customers have fallen from 32,319 thousand at the end of FY2022 to 31,255 thousand at the end of FY2025 [3] [4]. The structure is a duopoly that is being converted into a three- and four-way contest by wireless and fiber. This builds on the fuller market-share treatment in Business.
Regulatory entry barriers — real for the physical build, thin against wireless. Comcast's cable franchise rights are agreements with state and local authorities granting access to homes and businesses; the company carries them as indefinite-lived intangibles precisely because "there are no legal, regulatory, contractual, competitive, economic or other factors that limit the period over which these rights will contribute to our cash flows" [5]. The franchise regime raises the cost and delay of building a competing wireline plant. It does nothing to block a wireless carrier beaming 5G home internet over spectrum it already owns — which is exactly the vector now taking subscribers. So the regulatory moat is genuine against one class of entrant and absent against the class that is currently winning share.
Capital intensity — a deep moat against overbuild, self-funded. Replicating Comcast's plant is a multi-decade, tens-of-billions undertaking: Connectivity and Platforms capital expenditure alone rose 5.3% to $8.7 billion in FY2025 [6], sustaining a network already passing ~65 million premises [7]. No wireline rival will economically overbuild that footprint at scale. The qualifier, again, is that the moat is asset-specific: fixed-wireless entrants do not need to replicate the plant to compete for the customer.
Essentialness — high and rising, which cuts both ways. Home broadband is now a near-utility; demand is inelastic and grew through the last downturn. That is why Comcast can raise price into subscriber losses. But essentialness attaches to the connection, not the provider — a household that must have broadband will take it from whoever is cheapest and fast enough, which is what makes the fixed-wireless and fiber alternatives dangerous rather than reassuring.
Operating history — long, and proven through cycles. Comcast has operated since 1963 [8] — a 62-year history spanning multiple recessions and the entire shift from cable-TV to broadband as the profit core. Survivorship through cycles is evidenced. It is not, by itself, evidence about the next technology transition, which is the one that matters here.
The structural threats, hunted and sized
A real search of Comcast's own filings and the peer corpus surfaces three named, quantifiable threats — not one is perfunctory.
Fixed-wireless access is taking broadband subscribers now. T-Mobile and Verizon sell 5G home internet that Comcast names as a direct broadband competitor [9]. The scale of the ambition is in the attackers' own words: T-Mobile has told investors it is targeting 18–19 million broadband subscribers by 2030, describing the additions as "all incremental" [10]. Against Comcast's 31.3 million broadband base [11], a cable industry ceding even a few million subscribers per year to FWA is the mechanism already visible in Comcast's accelerating net losses: −66 thousand in FY2023, −411 thousand in FY2024, −711 thousand in FY2025 [12] [13].
Fiber overbuild is the second front. AT&T, Lumen and Verizon are building fiber "further into their networks," enabling speeds that exceed legacy copper DSL, and are offering those services in Comcast's markets [14]. Where a fiber overbuilder arrives, the duopoly becomes a three-way split and Comcast's local share compresses. The two threats are not additive noise; they arrive together, from opposite technology directions, at the same household.
Video is already in structural decline — the X3 evidence, stated plainly. Residential video is not a risk; it is a run-off. Domestic video customers have fallen from 18,176 thousand at the end of FY2021 to 11,270 thousand at the end of FY2025 — a loss of 6.9 million customers, or 38%, in four years, with a 1,253-thousand drop in FY2025 alone [15] [16]. Management attributes it to the secular shift: "As consumers increasingly turn to DTC streaming services in lieu of linear video services … our video customers and video revenues … each decrease" [17], and guides to continued declines from "shifting video consumption patterns and the competitive environment" [18]. This is genuine structural decline in a segment — but at the consolidated level it has so far been masked by broadband and wireless pricing (see the disqualifier check).
Source: FY2023 10-K operating statistics (total domestic broadband customers 32,253 thousand; total domestic video customers 14,106 thousand) [19] and FY2025 10-K operating statistics (total domestic broadband customers 31,255 thousand; total domestic video customers 11,270 thousand) [20].
Execution is holding the line for now — Xfinity Mobile added 1,479 thousand lines in FY2025 to reach 9,305 thousand, and management is repricing the broadband base [21]. Under the framework, out-executing is not a moat: it protects the next few years, not year ten.
The disqualifier check
fit_features.revenue_trajectory reports three_year_hsd_decline: false and consecutive_decline_years: 1. The disqualifier — revenue down high-single-digit for three consecutive fiscal years — does not fire. Consolidated revenue has been flat: $121.4B (FY2022), $121.6B (FY2023), $123.7B (FY2024), $123.7B (FY2025), a single −0.02% year in FY2025 after two years of low-single-digit growth.
Source: fit_features.revenue_trajectory (derived from company filings); consolidated revenue per the FY2025 10-K Consolidated Statement of Operations.
The flat line is the crux of the two-sided read. It is held up by product-level pricing that is moving in opposite directions underneath. Domestic broadband revenue rose to $25,837M in FY2025 from $25,660M (FY2024) and $24,999M (FY2023) even as subscribers fell, and domestic wireless revenue climbed to $4,967M from $4,273M and $3,664M — while domestic video revenue fell to $26,387M from $27,791M and $29,576M [22]. Average monthly Connectivity and Platforms revenue per customer relationship rose 0.9% to $131.77 [23]. So at the consolidated level, structural decline is checked and absent today; within the mix, video decline is present and offset by broadband/wireless price.
Source: FY2025 10-K Connectivity and Platforms revenue detail (domestic broadband 25,837; domestic wireless 4,967; video 26,387) [24].
FCF consistency (P2)
Reported free cash flow is the stable part of the picture. Across FY2016–FY2025 it has been positive every year and range-bound between roughly $10.6 billion and $21.9 billion, with the level ratcheting up over the decade — from $10,556M (FY2016) to $21,893M (FY2025), the latter helped by working-capital and timing rather than a step-change in the business.
Source: company filings, as reported (data/financials/cash_flow.json); FCF = operating cash flow − capital expenditures.
There are no negative episodes and no five-to-eight-year cyclical drawdowns — Comcast is not an underwriting-cycle business, so the P2 question of "inherent negative episodes" does not apply. The one honest caveat is that the adjusted-FCF series the framework prefers (fit_features.fcf_stability, built on FCF − SBC − 5-year-average acquisitions) is not_computable here because stock-based compensation is missing from the feed for all ten years; the reported series above is the substitute, and its stability is unambiguous. On the cash-consistency leg, the read is: consistent, not unpredictable.
The year-10 case, both ways
The strongest case that year-10 revenue and FCF are both higher. Home broadband is essential and its demand is inelastic; Comcast owns an irreplaceable plant passing 65 million premises [25] that no one will economically overbuild [26]. The company has already shown it can grow broadband revenue while losing subscribers, because ARPU and a fast-growing wireless attach more than offset volume [27]; a DOCSIS-4.0 multi-gig upgrade keeps the plant competitive on speed [28]. Ten years out, a smaller broadband base at a higher price, plus a large wireless and content/parks business, plausibly clears today's revenue and easily clears today's free cash flow, which the decade-long series shows is structurally resilient.
The strongest doubt. The revenue leg leans on price to offset volume, and that lever is finite. Fixed-wireless (T-Mobile targeting 18–19 million broadband subs by 2030, "all incremental" [29]) and fiber overbuild [30] attack the base from two sides at once, and broadband net losses are accelerating, not stabilizing: −66k, −411k, −711k across FY2023–FY2025 [31] [32]. If a competitor prices to hold share, Comcast cannot both keep raising ARPU and keep the base — at which point the flat top line bends down. Video, a fifth of the revenue mix, is already in 38%-over-four-years run-off [33].
My read, once: the gate does not hold at very-high conviction, and the reason is a genuine structural doubt on the revenue leg — accelerating broadband subscriber losses to fixed-wireless and fiber, with price as the only offset and a segment (video) already in secular decline. The free-cash-flow leg is defensible; the revenue leg is not high-conviction, and the gate requires both. What would change the read: broadband net losses flattening and stabilizing (evidence the FWA/fiber share-taking has a ceiling), or wireless and content growing large enough to carry the consolidated top line independently of the broadband base. Until then, the honest answer under this framework is that the year-10 revenue outcome carries genuine doubt — which, by construction, is a failed gate, and stating it is the tab's job, not its failure.
Self-Help
Comcast can fund its own rescue. It carries $98.9 billion of debt, but the ladder is roughly $5 billion a year against $20–22 billion of annual free cash flow, backed by $9.5 billion of cash and an undrawn $11.8 billion revolver [1]. It has retired 24% of its shares since 2016 and covers a 5.9% dividend at a low-twenties payout [2]. The counter-fact: buybacks are paused from July 1, 2026 through the announced company separation, so the flywheel sits idle for about a year [3].
The balance sheet against the problem's duration
Comcast's debt is large in absolute terms and unremarkable in shape. Total debt was $98.9 billion at year-end 2025, essentially flat versus $99.1 billion a year earlier, and substantially all of it is fixed-rate at a 4.0% weighted-average effective rate [4]. More than half — $55.4 billion — is in senior notes maturing beyond ten years, so the refinancing exposure to today's higher rates is spread across a decade, not concentrated in a wall [5].
Source: FY2025 Annual Report (Form 10-K), Quantitative and Qualitative Disclosures About Market Risk [6]. Variable-rate debt is only $3.2 billion in total.
The near-term maturities — $5.9 billion in 2026, then $5.0 billion, $5.7 billion, $4.8 billion and $4.8 billion through 2030 — each sit comfortably inside a single year of free cash flow, at coupons of 2.1% to 4.0% [7]. The current portion of debt was $6.0 billion against $9.5 billion of cash [8].
Liquidity beyond cash is a $11.8 billion revolving credit facility due May 2029 (expandable to $14.8 billion and extendable to 2031), which was fully undrawn at year-end, as was the commercial paper program it backs [9]. That is roughly $21 billion of immediately available liquidity before a dollar of operating cash. The facility carries a single financial covenant — a debt-to-EBITDA ratio — with ample headroom: net debt of about $89.4 billion ($98.9 billion less $9.5 billion cash) against an EBITDA proxy of roughly $36.9 billion (FY2025 operating income of $20.7 billion plus $16.2 billion depreciation and amortization) is near 2.4x [10] [11]. The January 2026 spin of Versant also de-consolidated $3.0 billion of debt [12].
The deterministic feature file returns balance_sheet_class: unknown because the structured financial feed carries no debt line; the class above is computed from the filed 10-K rather than the feature, and the ~2.4x leverage places Comcast as moderately levered — below the framework's 3.0x "levered" threshold. On that reading, capital allocation is not forced toward debt paydown: with maturities near $5 billion a year against $20 billion of adjusted free cash flow, the company can service, refinance and repurchase at the same time. The balance sheet lets it outlast a multi-year broadband problem without a forced choice.
The repurchase record — executed, not authorized
This is the strongest fact on the page. Over 2016–2025 Comcast spent about $62.7 billion of cash on buybacks and took its share count from 4,875 million to 3,709 million — a 24% reduction, and a 4.3% annual pace over the last five years [13]. The share_count_trend feature confirms the direction: rising: false, five-year CAGR −4.3%.
Buybacks 2016–2025 ($B)
Share Count Reduction
Capital Returned FY2025 ($B)
Source: derived from FY2016–FY2025 Consolidated Statements of Cash Flows [14]; share counts from fit_features.share_count_trend.
Source: FY2016–FY2025 Consolidated Statements of Cash Flows, repurchases of common stock line [15]; FY2016–FY2023 figures from fit_features.share_count_trend.buyback_cash_per_year.
Source: fit_features.share_count_trend.per_year, from company filings.
The record is not smooth, and the pattern is itself informative. Buybacks ran near $5.4 billion a year through 2018, then collapsed to roughly $0.5 billion in 2019–2020 while Comcast digested the $39 billion Sky acquisition and deleveraged — the framework's own test of whether debt paydown crowds out repurchases, answered in real time. Once leverage normalized, the program came back hard: $13.3 billion in 2022, $11.3 billion in 2023, $9.1 billion in 2024, $7.2 billion in 2025 [16]. In 2025 the company bought 205 million shares for $6.8 billion under authorization and had $8.9 billion remaining on a $15 billion program that carries no expiration [17]. Management notes that repurchases have more than offset the dilution from share-based compensation, so the count falls on a net basis — the opposite of the framework's SBC-driven hard-fail [18].
The engine is currently switched off. On the Q2 2026 call management confirmed it paused repurchases as of July 1, 2026 and expects to remain paused through the planned separation of Comcast into two companies, targeted for completion in about a year, with no resumption date given. The buyback tailwind the framework is built around is unavailable until the split is done.
Source: Q2 FY2026 Earnings Call, Jul 23 2026 [19].
Management's buyback intent, from the record
Management's stated hierarchy is invest organically, maintain a strong balance sheet, then return capital — and it says the strategy is "unchanged" [20]. Through 2025 the actions matched the words. The pause is framed not as a retreat but as balance-sheet preparation: the CFO tied it to ensuring "both businesses are well capitalized with favorable investment-grade ratings" ahead of the separation [21]. When JPMorgan pressed for the post-split target leverage and dividend policy, management declined to add detail beyond the separation announcement — so the shape of the buyback on the far side of the split is, for now, unspecified.
Insider buying is not part of the case. Directors receive routine stock grants, but there is no pattern of open-market purchases by executives; Comcast's alignment runs through the Roberts family's controlling Class B stake rather than incremental insider bids (see management credibility below).
The absurdity check — years of cash flow to retire the float
Adjusted free cash flow is not in the feature file — adjusted_fcf returns not_computable because the structured feed carries no share-based-compensation line — but every input exists in the filed 10-K, so the arithmetic can be shown from primary figures. FY2025 free cash flow of $21.9 billion, less $1.29 billion of share-based compensation, less a five-year average acquisition spend of about $0.56 billion (2021–2025: $1.37B, $0.01B, $0, $0.12B, $1.31B), gives adjusted free cash flow near $20.0 billion [22] [23].
Adjusted FCF FY2025 ($B)
Market Cap ($B)
Years to Retire Float
Source: adjusted FCF derived from the FY2025 and FY2023 10-K cash-flow statements [24]; market cap from fit_features.market_cap ($82.7B at $22.295, Jul 24 2026). The fit_features.float_retirement_years field is not_computable.
At the $82.7 billion market capitalization, $20.0 billion of adjusted free cash flow would retire the entire float in about 4.1 years. The framework treats a ~3-year answer as a price making a claim that cannot survive; 4.1 years is in the same territory, and it sits alongside a demonstrated willingness to actually spend the cash on shares. The consensus forward view does not contradict it — sell-side free-cash-flow estimates imply a 16–19% yield on today's market cap through 2029, so the buy side's fear is not shared by the analysts modeling the cash [25]. The yield computation itself belongs to the Yield tab; here it matters only as the denominator of the absurdity check.
On the levered-exception test, which the framework applies when the adjusted yield runs very high (~25%+), all three legs are present rather than two of three: an adjusted yield near 24% ($20.0B on $82.7B), a multi-year share-count reduction of 24%, and free cash flow and revenue that are not deteriorating (revenue flat near $124 billion, adjusted FCF stable-to-rising). Comcast is only moderately levered, so the default 10% reference bar — not the 25% levered bar — is the one that formally applies; it clears either reading.
Dividend safety
The dividend is a material part of the return here — $1.32 per share is a 5.9% yield at $22.295 — so it earns a full look rather than a sentence [26]. Coverage is not close to strained: $4.9 billion of dividends paid in 2025 is about 22% of $21.9 billion reported free cash flow, and roughly 24% of the $20.0 billion adjusted figure [27]. Total capital returned in 2025 — $7.2 billion of buybacks plus $4.9 billion of dividends, about $12.0 billion — still consumed only 55% of free cash flow, so the dividend is the most protected claim on the cash, with buybacks as the flexible layer above it [28].
Source: FY2021–FY2025 Consolidated Statements of Cash Flows [29].
The payment record is the reassuring part: Comcast raised the dividend for 17 consecutive years through the January 2025 increase to $1.32, and paid it uninterrupted through the 2020 pandemic year even as buybacks were cut to near zero [30]. The honest qualifier sits in the most recent decision: in January 2026 the board held the cash dividend flat at $1.32 rather than raising it — the first time in the streak it did not increase the per-share rate [31]. Management still describes 2026 as its "eighteenth consecutive year of dividend growth," but that claim leans on the Versant shares distributed in kind rather than on a higher Comcast cash payment [32]. At a low-twenties payout the dividend is not at risk from coverage; what would force a cut is not this year's math but a permanent, severe erosion of broadband cash generation — the durability question, not the balance-sheet question (Dislocation).
Management credibility
Comcast does not fit the promotional-CEO exclusion, and the record supports that rather than merely asserting it. It is a 60-year-old business run by a founding family whose control is structural: Brian Roberts's Class B stock carries a non-dilutable 33⅓% of the combined vote, so the alignment is through a permanent controlling stake, not a quarterly-EPS incentive [33]. That control is itself a governance cost — minority holders cannot force a capital-return change — but it is the opposite of a manager with no skin in the game.
Promise versus delivery, on a sample of the most material commitments of the last few years:
- Dividend growth. Promised and delivered — the 15th, 16th and 17th consecutive annual increases across January 2023, 2024 and 2025, then held flat in 2026 [34].
- Buyback resumption after Sky. Promised a return to repurchases once deleveraged; delivered $13.3 billion, $11.3 billion, $9.1 billion and $7.2 billion in 2022–2025 [35].
- Peacock profitability. In April 2026 management guided Peacock to "approach profitability" the next quarter; Q2 2026 delivered a first profitable quarter of $189 million of EBITDA — kept.
- Connectivity and Platforms EBITDA improvement. Guided in January 2026 to modest improvement after lapping investments in the second half of 2026; through the July 2026 call segment EBITDA was still falling (−5.8% in Q2 2026) — the one open, slipping guide rather than a kept one.
The pattern is a capital-return promise reliably kept and an operating-turn promise still pending, not a habit of big claims and repeated misses. Nothing here rises to the eHealth-style exclusion the framework screens for; the live risk to credibility is execution on the broadband turn, which the Durability tab carries.
Clock
Comcast's re-rating depends on operational repair, not a one-quarter forecast reset: broadband subscriber losses have to narrow toward flat and wireless has to monetize its free-line base, with the announced NBCUniversal separation as the structural catalyst (management targets completion around mid-2027). Against that, the buyback flywheel — the fastest mechanical lever — was paused on July 1, 2026 through the split. The stock's own history offers one comparably deep drawdown (1999–2009), and it took years, not quarters, to repair. Long-dated listed options exist and are cheap.
The re-rating mechanism
Three things would close the gap between a roughly 16–20% consensus forward free-cash-flow yield (Yield) and a $22 share price. Each has a mechanism, evidence it is in motion, and a rough window; none is a bet on sentiment alone.
1 — Broadband stabilization (the operational core). The dislocation (Dislocation) is a subscriber story: fiber overbuild, fixed-wireless competition, and now satellite have pressured Xfinity broadband. The mechanism is not a price reset but a loss-rate curve bending back toward flat. It is measurably in motion: second-quarter 2026 broadband subscriber losses improved by 34,000 year-over-year to a loss of 167,000, which management attributes to a new go-to-market strategy in pricing and packaging [1]. Broadband ARPU still declined 3.8%, so revenue stabilization lags unit stabilization [2]. Window: management guides to "modest improvement" as it anniversaries the strategy launch and free wireless lines convert "as we exit this year" — i.e. Q4 2026 (reported late January 2027) into 2027.
2 — Wireless and convergence monetization. Xfinity Mobile added a record 448,000 net lines in the second quarter of 2026, its best quarter on record, crossing 10 million lines at roughly 7% penetration [3]. Roughly half of residential postpaid phone connects came on a free-line offer; the re-rating driver is conversion of those free lines to paid, which management expects to accelerate in the second half of 2026 [4]. Convergence ARPA sits near $85, which management states is well below telecom peers, framing the monetization runway rather than proving it [5]. Window: a 2026–2027 monetization ramp, dependent on conversion holding.
3 — The NBCUniversal separation (the structural catalyst). Comcast completed the spin of its cable networks into Versant Media Group (Nasdaq: VSNT) on January 2, 2026 [6], and has since announced a further, larger separation of NBCUniversal and Sky into a second standalone company, with management targeting completion "in approximately 1 year" from the July 2026 call — roughly mid-2027 [7]. The re-rating logic is a sum-of-the-parts unlock: a cleaner connectivity company valued on broadband/wireless economics, separated from media. Window: a dated, structural catalyst around mid-2027 — at the far edge of an 18-month horizon.
4 — Epic Universe's first full year. The Universal Orlando theme park Epic Universe opened in May 2025 [8]; fiscal 2026 is its first full year of attendance and spend, a revenue tailwind in the segment that heads to the separated media company.
The counter-fact, stated plainly — the fastest lever is switched off. The buyback flywheel is the one mechanism that adds to per-share value without waiting on operations, and Comcast has run it hard: 205 million shares retired for $6.8 billion in 2025 alone, with $8.9 billion left on the authorization at year-end [9]. That lever was paused as of July 1, 2026 and is expected to stay paused through the separation, to keep both companies investment-grade [10]. So for roughly the next year the denominator stops shrinking at exactly the horizon this tab measures — this is the ledger's live falsifier (capital allocation pivoting away from repurchases), and it is currently firing.
Sources: Q2 FY2026 earnings call [11] [12]; earnings dates from consensus calendar, as reported.
Base rates from Comcast's own history
Quality franchises swing far more than their intrinsic value does, and Comcast's 36-year price record shows it. The current fall — down about 51% from the November 2024 local peak of $45.14 to the July 2026 low of $21.92 (the capitulation gauge's anchor), and about 65% from the September 2021 all-time high of $61.75 — is the second-deepest drawdown in the company's history. The gauge measures the recent leg; the deeper reference point is the 2021 high.
Source: derived from daily closing-price history, 1990–2026 (data/prices/daily.json), as reported.
Source: derived from daily closing-price history (data/prices/daily.json); depth = (trough − peak)/peak, durations in calendar years, as reported.
The arithmetic a skeptic can recompute: the two moderate drawdowns round-tripped fast because they were shallow. The 2018 selloff fell 29% ($42.99 → $30.59) and reclaimed its high in about 15 months; COVID fell 32% ($47.50 → $32.42) and recovered in about 10 months. Neither is comparable in depth to today. The only comparably deep episode is 1999–2009: a 68% decline ($17.71 → $5.61) that took roughly nine years to trough and about 12.7 years to reclaim the old high — though that peak carried a dot-com/consolidation-era multiple, so "reclaim the high" overstates the repair needed. Measured off the 2009 low instead, the recovery was faster: up 50% in about six months, doubled in about 1.8 years, tripled in about 3.4 years.
The read from the base rates: an 18-month full re-rating out of a 50%-plus drawdown has no precedent in Comcast's own history. The one time it fell this far, repair ran in years. The bullish counter is that today's fall may be a 2018/2020-style overshoot in a deeper disguise — half the decline came only after the November 2024 peak — in which case a catalyst can compress the timeline.
The 18-month test
Given the mechanism and the base rates, re-recognition of value within roughly 18–24 months is plausible for the signal but not for the printed recovery. The operational tell — broadband losses narrowing toward flat and free-line conversion showing up in convergence revenue — can appear inside the window, at the Q4 2026 and 2027 prints, and the NBCUniversal separation lands near the window's far edge around mid-2027. But consensus does not expect the printed cash flows to recover to fiscal-2025 levels until fiscal 2028–2029 (below), the buyback lever is off until the separation closes, and the only deep-drawdown precedent took years. This read is falsified if the broadband loss-rate stops improving or reverses, or if the separation slips — the same triggers that seed the falsifier ledger. On balance the path looks like cycle-and-execution repair measured in years, with a catalyst (the split) that could pull the market's recognition forward of the printed numbers.
What consensus expects, and when
The sell side is not capitulated and not piled in — it is on the fence. Of 27 covering analysts, 33% carry a buy, 56% a hold, and 11% a sell, and the mean price target of $30.37 sits about 36% above the $22.30 quote (consensus data, as of July 25, 2026). A cheap-looking target paired with a hold rating is the signature of "value without a catalyst conviction," not of a capitulated street.
Price (Jul 24, 2026)
Mean target
Implied upside
Source: consensus price targets and recommendations, as of Jul 25, 2026 (27 analysts); range $21 low to $44 high, as reported.
Source: consensus recommendation distribution, as of Jul 25, 2026, as reported.
The quarterly path — when consensus expects the recovery to print. Consensus sees earnings troughing first, then a shallow turn. Adjusted EPS is modeled at about $3.51 for fiscal 2026, down roughly 18% from fiscal 2025's ~$4.31, before a modest $3.64 in fiscal 2027 (up about 4%). On cash, consensus free cash flow troughs later — around $13.3 billion in fiscal 2027 — and does not climb back toward fiscal-2025's ~$16.9 billion until fiscal 2028–2029.
Source: consensus free-cash-flow estimates (data/sp/estimates.json), as reported.
Two facts complicate the picture in Comcast's favor and against it. Against: near-term estimate revisions are drifting down, not up — fiscal-2027 EPS estimates have fallen from about $3.84 to $3.64 over the past 90 days. For it: the company has beaten consensus EPS every quarter for two years, including $1.04 versus a $0.97 estimate in the second quarter of 2026, so the printed trough may prove shallower than modeled. The candidate quarter for a re-rating is the fiscal-2026 fourth-quarter print (reported late January 2027), when the broadband-stabilization thesis is first testable against a full anniversary of the strategy; the next scheduled catalyst before it is the October 29, 2026 third-quarter report.
The instruments (facts only)
The framework's expression test — whether listed options with expiries of twelve months or more, ideally eighteen-plus, exist — is satisfied. Comcast (CMCSA) has an actively traded, OCC-listed single-name options market, and the listed chain extends to the January 21, 2028 expiration, roughly eighteen months beyond today. Liquidity is high: contract volume averages in the tens of thousands of contracts per day across the chain, consistent with a large-cap underlying.
On price of that optionality: the 30-day mean implied volatility was about 31% as of July 24, 2026 (per AlphaQuery), against realized 30-day volatility near 38% — an implied level well below the framework's reference band (up to roughly 50–55 acceptable, 60–70 elevated). One source dated June 26, 2026 put the implied-volatility rank near the 78th percentile of its own recent range, so options are dear relative to Comcast's quiet norm but cheap in absolute, cross-name terms. These are stated as dated facts from web research, not advice; no strikes, expiries, or structures are recommended here, and the implied-volatility figure is a cited source reading, not an estimate.